Project America illustrated the overall number of students enrolled in all levels:
Click on the chart below to see an enlarged, clearer chart.

For additional information, click on Project America: Education: Degree Attainment.
Project America illustrated the overall number of students enrolled in all levels:
Click on the chart below to see an enlarged, clearer chart.
For additional information, click on Project America: Education: Degree Attainment.
The National Center for Education Statistics made the following points about U.S. education:
To read additional information, click on National Center for Education Statistics.
PLA had an article on economic growth:
To read the entire article, click on Just for the Record Part III.
PLA had an article on inflation:
To read the entire article, click on Just for the Record Part V.
Kelsey Golden in September of 2008 posted an article on ScoopThis.org illustrating relationships between state unemployment rates, controlling political party, and state income taxes.
To read the entire article, click on High Unemployment Rates Tied to Democrat Controlled States and Higher State Taxes; States with Lower Rates Controlled by Republicans with Lower State Taxes.
Dan Ackman on Forbes.com did an analysis comparing Democratic presidents and Republican presidents.
To read the entire article click on Presidents And Prosperity.
WorkforAll had the following graph for European countries:
Click on the chart below to see an enlarged, clearer chart.
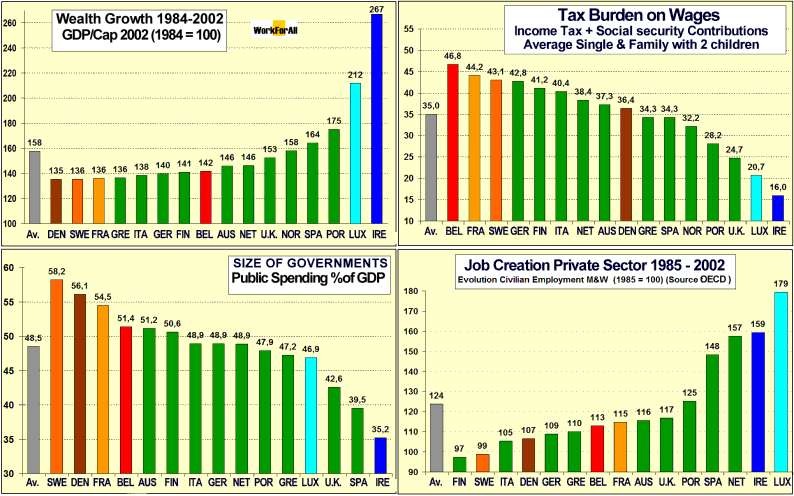
To read the entire article, click on EU : Causes of Growth differentials in Europe.
Laura Rowley on Yahoo Finance asked “what’s at the heart of the U.S. savings problem?” According to Ron Wilcox, professor at the Darden School of Business at the University of Virginia, the answer is “the widening gap between rich and poor. The concentration of income among the wealthiest 1 percent of Americans has roughly doubled in the last 30 years. In 2004, for example, the wealthiest 1 percent of Americans enjoyed a 12.5 percent increase in income, while the bottom 99 percent gained only 1.5 percent.”
To read the entire article, click on Double Bind: Savers on the Hook for Squanderers.
The Center for American Progress in April 2007 reported the following statistics on poverty in the U.S.A.:
To read the entire report, click on From Poverty to Prosperity: A National Strategy to Cut Poverty in Half.
Click on the chart below to see an enlarged, clearer chart.
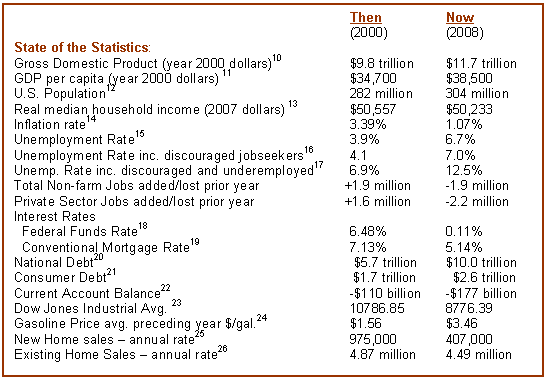
To read the entire article from the Pew Research Center, click on States of the Union Before and After Bush.