truthful politics reviewed jobs statistics provided by the United States Bureau of Labor Statistics and the top tax rate provided by the Tax Policy Center and the Tax Foundation. The Bureau of Labor Statistics provides the official numbers on jobs gained or lost for the U.S. The chart below shows how many jobs annually were […Full Article]
Causes & Solutions of Income Inequality
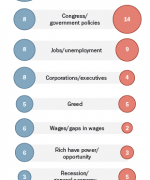
Robert Gordon and Ian Dew-Becker in May 2008 wrote the following about economic inequality in the United States: Between 1979 and 2005, the income gap for women between the 50th percentile and the bottom 10th percentile grew more than for men at the same income levels for the same time period. Between 1973 and 2001, […Full Article]
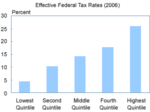
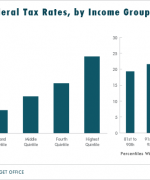
The Congressional Budget Office in April 2009 illustrated it’s “most recent estimates of federal effective tax rates (taxes as a percentage of income) across household income groups for the four largest sources of federal revenues.” Click on the chart below to see an enlarged, clearer chart. Click on the chart below to see an enlarged, […Full Article]
Federal Taxes Paid by Income
The Congressional Budget Office (CBO) in December 2013 presented estimates on “the distribution of household income and federal taxes in 2010.” The 2010 estimate was released in 2013. The bottom 20% of income earners had an average tax rate of 1.5%. The top 20% of income earners had an average tax rate of 24%. “The […Full Article]
Chuck Marr and Chye-Ching Huang in September 2012 from the Center on Budget and Policy Priorities reported on the percentage of people that pay taxes. The types of taxes are broken into different categories from income taxes, to payroll taxes, to state and local taxes. Federal Income Taxes In 2007, 40 percent of households did […Full Article]
The Office of Management and Budget annually provides a report on U.S. federal government spending and revenue. The first set of numbers uses Table 1.3 of the budget. The numbers are inflation adjusted, displaying all dollar amounts in constant fiscal year 2005 dollars, as provided by the Office of Management and Budget. Therefore, dollar amounts […Full Article]
Distribution of Income & Wealth
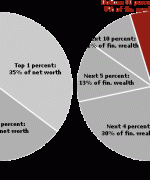
This article contains information and statistics from several sources about income and/or wealth distribution in the United States. G. William Domhoff in February of 2013 wrote about the distribution on income & wealth in the U.S.A. The definition of wealth used in the article is the value of everything a person or family owns, minus […Full Article]
Simpson-Bowles National Commission on Fiscal Responsibility and Reform
This article contains several charts and videos concerning the National Commission on Fiscal Responsibility and Reform. All the charts expand to make the data easier to view. Click on a chart to expand it, and click on the expanded chart to shrink it back to its original size. The National Commission on Fiscal Responsibility and […Full Article]
U.S. Federal Government Revenue (Current & Inflation Adjusted)
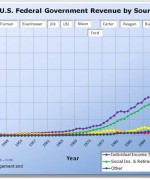
truthful politics reviewed historical statistics on U.S. federal government revenue as provided by the Office of Management and Budget. The Office of Management and Budget provides the official numbers for the annual budget for the U.S. This article has several charts on U.S. federal government revenue; click on the chart to expand it; click on […Full Article]
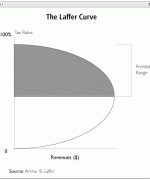
Below are statistics from several sources on if cutting taxes increase or decrease government revenue, or tax receipts. The first chart shows government revenue as a percentage of the economy, or Gross Domestic Product (GDP). The major tax cuts occurred in 1918 – 1925, 1964, 1981, 2001, and 2003. Click on the chart below to […Full Article]