Apr 242014
The Congressional Budget Office (CBO) in December 2013 presented estimates on “the distribution of household income and federal taxes in 2010.” The 2010 estimate was released in 2013.
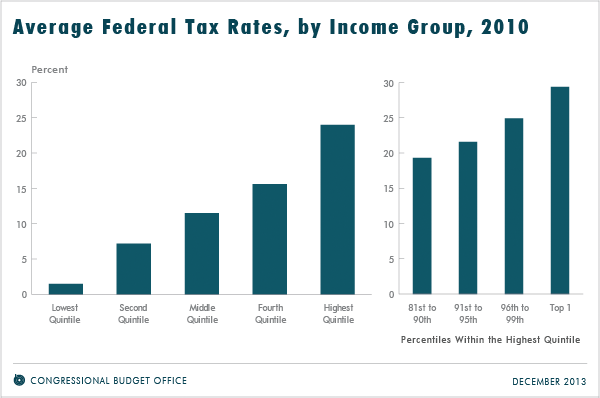
- The bottom 20% of income earners had an average tax rate of 1.5%.
- The top 20% of income earners had an average tax rate of 24%.
- “The top 1 percent of all households in the United States had an average federal tax rate of 29.4 percent in 2010.”
- “Households in the top quintile [top 20% of earners] (including the top percentile) paid 68.8 percent of all federal taxes, households in the middle quintile [top 40% – 60% of earners] paid 9.1 percent, and those in the bottom quintile [bottom 20% of earners] paid 0.4 percent of federal taxes.”
Click on the chart below to see an enlarged, clearer chart.
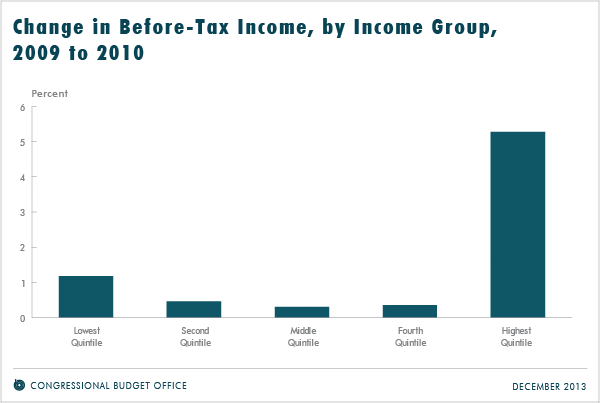
- The bottom 20% of earners received 5.1% of before-tax income, and after paying taxes, they received 6.2% of after-tax income.
- The middle 20% of earners received 14.2% of after-tax income and 15.4% of after-tax income.
- The top 20% of earners received 51.9% of before-tax income and 48.1% of after-tax income.
Click on the chart below to see an enlarged, clearer chart.
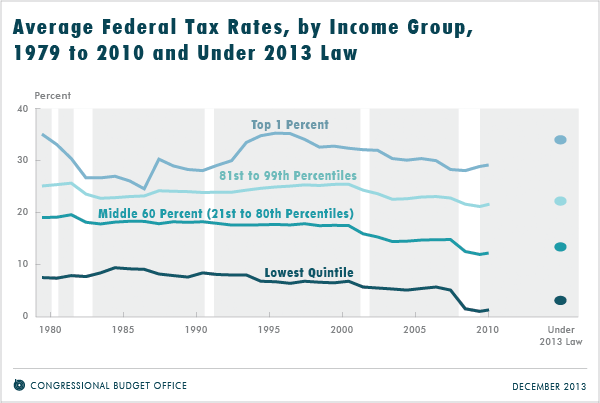
- “Even with the increases in average federal tax rates in 2010, the average rate for each income group was below the rate that prevailed for that group in the 1990s and most of the 2000s”
- “The exception was households in the top 1 percent, whose average federal tax rate in 2010 was significantly above its low in the mid-1980s.”
Click on the chart below to see an enlarged, clearer chart.
According to the CBO, tax rule changes between the years 2010 and 2013 will affect average federal tax rates in the following ways:
- “Tax rates will increase overall as a result of the changes in tax rules, with the largest increases at either end of the income distribution”
- The lowest quintile is projected to experiance average tax rate increases by 1.6 percent
- The middle quintile is projected to experiance average tax rate increases by 1.0 percent
- The top quintile is projected to experience average tax rate increases by 4.2 percent.
- “For most income groups, average tax rates under 2013 law are projected to remain below those in 2007, the year before the recession began, and well below those for most of the past three decades. For the top 1 percent of households, however, average rates under 2013 law will be higher than in any year since 1997.”
To read the entire report, click on The Distribution of Household Income and Federal Taxes, 2010.
Sorry, the comment form is closed at this time.