The Congressional Budget Office in April 2009 illustrated it’s “most recent estimates of federal effective tax rates (taxes as a percentage of income) across household income groups for the four largest sources of federal revenues.”
Click on the chart below to see an enlarged, clearer chart.
Click on the chart below to see an enlarged, clearer chart.
Click on the chart below to see an enlarged, clearer chart.
>
Click on the chart below to see an enlarged, clearer chart.
To see additional information, click on Data on the Distribution of Federal Taxes and Household Income.
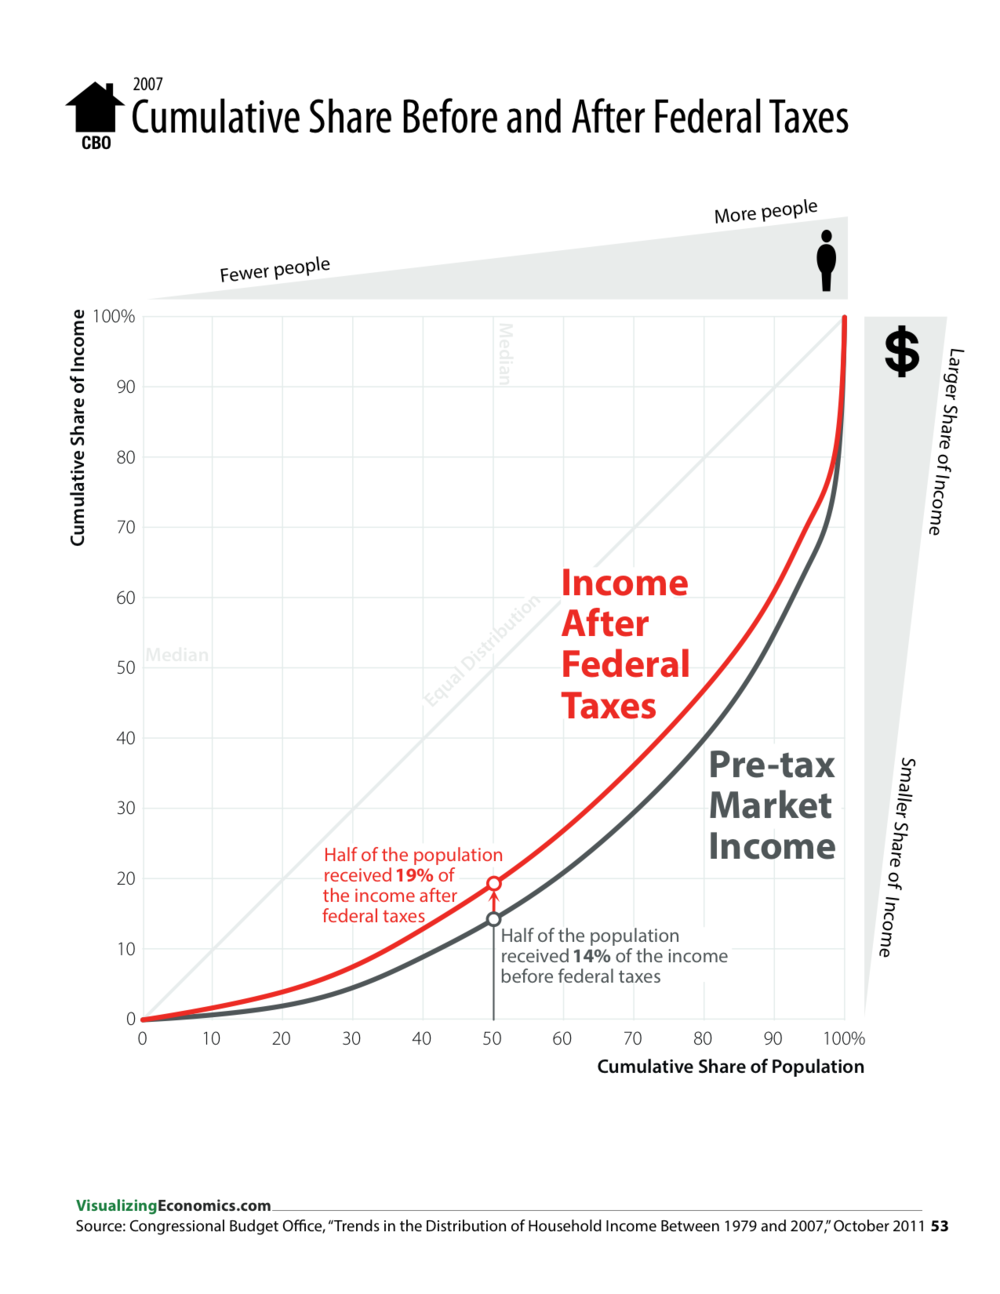
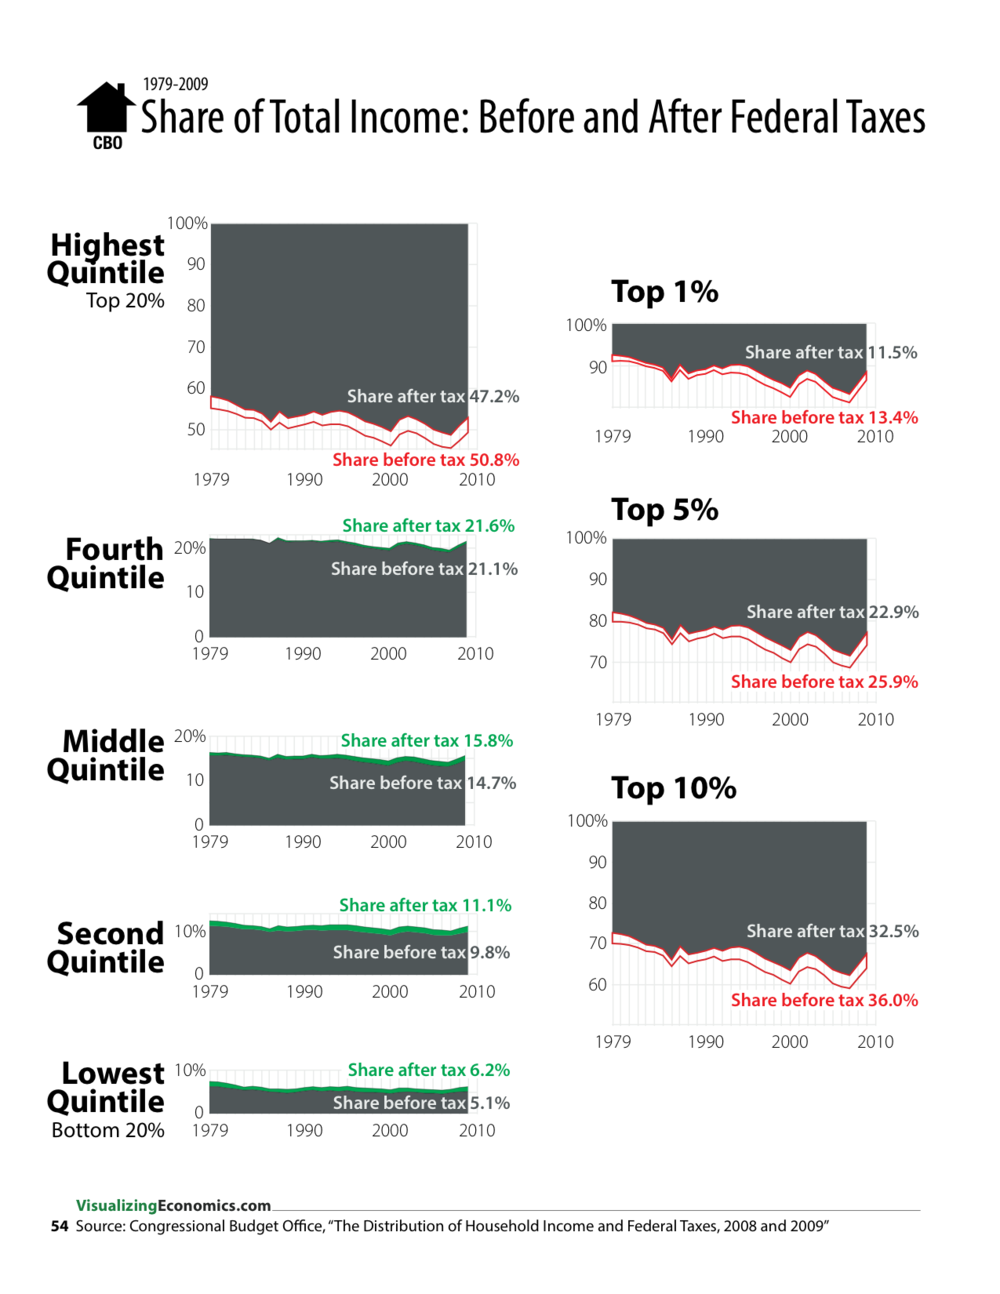
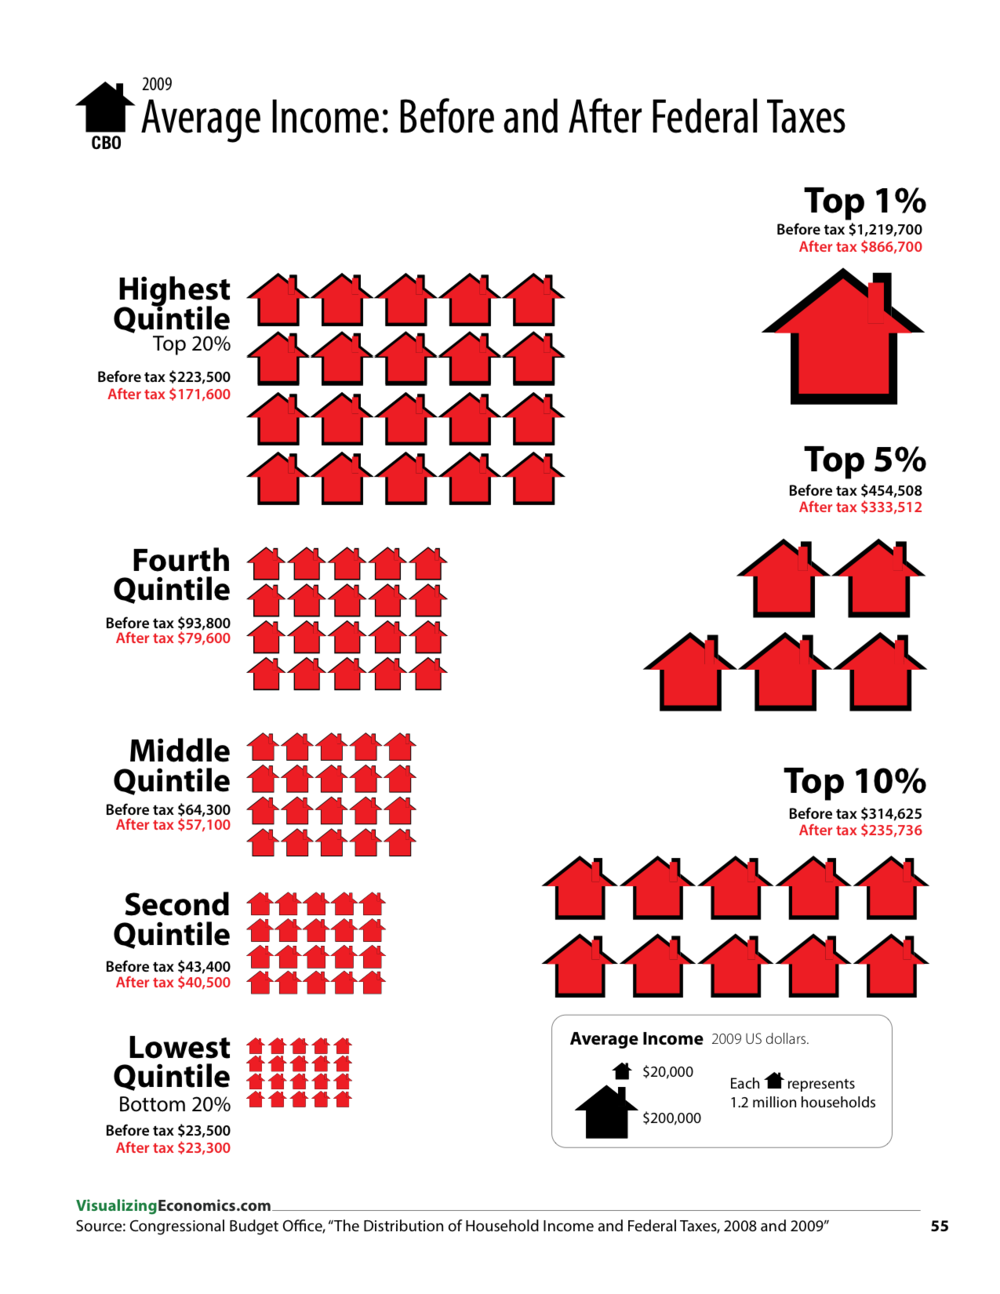
Catherine Mulbrandon in April 2014 illustrated the data as following:
Click on the chart below to see an enlarged, clearer chart.
Click on the chart below to see an enlarged, clearer chart.
Click on the chart below to see an enlarged, clearer chart.
To view additional charts, click on How much do federal taxes redistribute income?
Sorry, the comment form is closed at this time.