truthful politics reviewed U.S. debt statistics provided by the U.S. Office of Management and Budget. The Office of Management and Budget provides the official numbers on debt for the U.S. Below are several charts and pieces of information on U.S. federal debt. From 1940 to the end of year 2015 (the latest figures available as […Full Article]
U.S. Government Debt
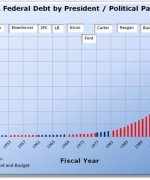
For U.S. federal (or national) government debt, click on the following: U.S. Federal Debt by President/Political Party U.S. Federal Debt Change (Increase/Decrease) by President Foreign Holdings of U.S. Securities/Debt The Federal Debt The U.S. Federal Debt Compared to Its Economy vs. Other Countries’ Federal Debt Compared to Their Economies Simpson-Bowles National Commission on Fiscal Responsibility […Full Article]
Simpson-Bowles National Commission on Fiscal Responsibility and Reform
This article contains several charts and videos concerning the National Commission on Fiscal Responsibility and Reform. All the charts expand to make the data easier to view. Click on a chart to expand it, and click on the expanded chart to shrink it back to its original size. The National Commission on Fiscal Responsibility and […Full Article]
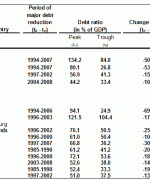
Christiane Nickel, Philipp Rother, and Lilli Zimmermann of VoxEU.org, a portal set up by the Centre for Economic Policy Research, in November 2010 reported how some European countries were able to rapidly lower government debt. Some of these strategies could be implemented in the U.S. to lower its government debt. As a government borrows more […Full Article]
As of the writing of this article, the U.S ranks #40 out of 129 countries, according to the CIA, the Central Intelligence Agency, in highest ratio of debt to GDP. The higher the ranking number the better; ergo, Libya has the lowest debt as a percentage of GDP and Zimbabwe has the highest. Other countries […Full Article]
truthful politics analysed a portion of the voting record for Congressman John Boehner, Republican from Ohio. Some of the larger, or well-known, bills are listed including the cost or savings to the federal government. CBO stands for Congressional Budget Office and is a nonpartisan agency of the United States federal government. 2010 – voted for […Full Article]
If an individual spent $1 million dollars a day for the past 2000 years, ignoring leap year days, they would have spent $730,000,000,000, or $730 billion dollars ($1,000,000 * 365 * 2000). The US Department of the Treasury lists the total Federal debt at over $13,668,825,497,341, or $13.6 trillion. This number will inherently be incorrect […Full Article]
Mary W. Walsh in The New York Times in October 2010 reported that the municipalities of New York face $200 billion in health care benefits to retirees. The health benefits are separate from the pensions. “Governments have reported their pension obligations for years, but their retiree medical obligations have been building up unseen, because governments […Full Article]
The following chart shows U.S. State and Local Government Debt as a percentage to GDP, or to the economy. The data starts in 1902. Click on the chart below to see an enlarged, clearer chart. US State And Local Debt As Percentage Of GDP Fiscal Years 1900 to 2009 Year GDP-US $ billion Gross Public […Full Article]
Truthfulpolitics.com reviewed the Preliminary Report on Foreign Holdings of U.S. Securities at End-June 2008 from the U.S. Treasury Department issued in February 2009. The report shows what countries hold United States debt and the amount. China (Mainland) excludes Hong Kong, Macau, and Taiwan, which are reported separately. Middle East Oil Exporters includes Bahrain, Iran, Iraq, […Full Article]