This article contains information and statistics from several sources about income and/or wealth distribution in the United States.
G. William Domhoff in February of 2013 wrote about the distribution on income & wealth in the U.S.A. The definition of wealth used in the article is the value of everything a person or family owns, minus any debts.
Income, net worth, and financial worth in the U.S. by percentile, in 2010 dollars
| Wealth or income class | Mean household income | Mean household net worth | Mean household financial (non-home) wealth |
|---|---|---|---|
| Top 1 percent | $1,318,200 | $16,439,400 | $15,171,600 |
| Top 20 percent | $226,200 | $2,061,600 | $1,719,800 |
| 60th-80th percentile | $72,000 | $216,900 | $100,700 |
| 40th-60th percentile | $41,700 | $61,000 | $12,200 |
| Bottom 40 percent | $17,300 | -$10,600 | -$14,800 |
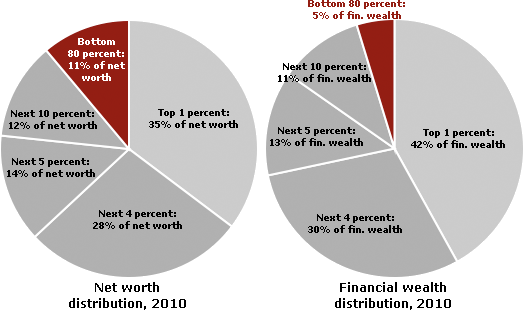
Net worth and financial wealth distribution in the U.S. in 2010
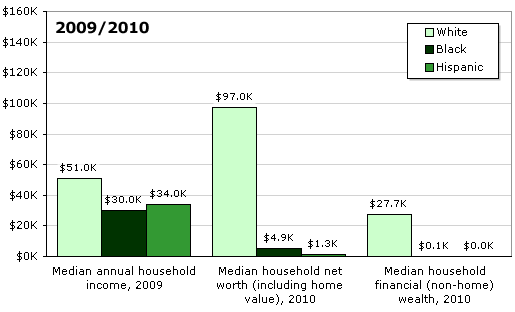
Income and wealth by race in the U.S.
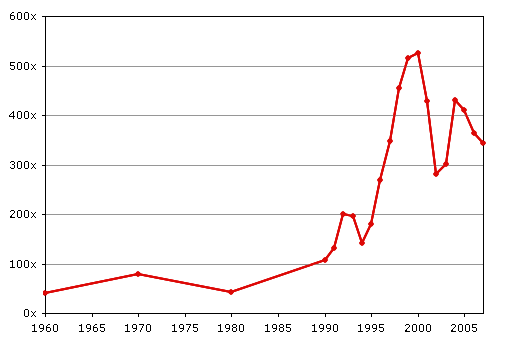
CEOs’ pay as a multiple of the average worker’s pay, 1960-2007
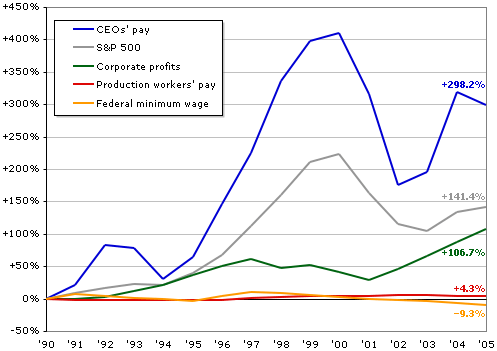
CEOs’ average pay, production workers’ average pay, the S&P 500 Index, corporate profits, and the federal minimum wage, 1990-2005 (all figures adjusted for inflation)
Distribution of Income:
- In 2008, 13,480 individuals or families made over $10 million.
- 19% of the income reported by those individuals or families came from wages and salaries.
Distribution of income in the United States, 1982-2006
| Income | |||
|---|---|---|---|
| Top 1 percent | Next 19 percent | Bottom 80 percent | |
| 1982 | 12.8% | 39.1% | 48.1% |
| 1988 | 16.6% | 38.9% | 44.5% |
| 1991 | 15.7% | 40.7% | 43.7% |
| 1994 | 14.4% | 40.8% | 44.9% |
| 1997 | 16.6% | 39.6% | 43.8% |
| 2000 | 20.0% | 38.7% | 41.4% |
| 2003 | 17.0% | 40.8% | 42.2% |
| 2006 | 21.3% | 40.1% | 38.6% |
| 2009 | 17.2% | 41.9% | 40.9% |
Distribution of Wealth:
- As of 2010, the top 1% of households owned 35.4% of all privately held wealth
- The next 19% of households had 53.5%
- Therefore, 20% of the people owned 89% (35.4% + 53.5%).
- Thus, the bottom 80% of people owned 11% of the wealth.
- 1.6% of Americans receive $100,000 or more in inheritance.
- 1.1% receive $50,000 to $100,000.
- The remaining 91.9% receive $0.
Share of wealth held by the Bottom 99% and Top 1% in the United States, 1922-2010.
| Bottom 99 percent | Top 1 percent | |
|---|---|---|
| 1922 | 63.3% | 36.7% |
| 1929 | 55.8% | 44.2% |
| 1933 | 66.7% | 33.3% |
| 1939 | 63.6% | 36.4% |
| 1945 | 70.2% | 29.8% |
| 1949 | 72.9% | 27.1% |
| 1953 | 68.8% | 31.2% |
| 1962 | 68.2% | 31.8% |
| 1965 | 65.6% | 34.4% |
| 1969 | 68.9% | 31.1% |
| 1972 | 70.9% | 29.1% |
| 1976 | 80.1% | 19.9% |
| 1979 | 79.5% | 20.5% |
| 1981 | 75.2% | 24.8% |
| 1983 | 69.1% | 30.9% |
| 1986 | 68.1% | 31.9% |
| 1989 | 64.3% | 35.7% |
| 1992 | 62.8% | 37.2% |
| 1995 | 61.5% | 38.5% |
| 1998 | 61.9% | 38.1% |
| 2001 | 66.6% | 33.4% |
| 2004 | 65.7% | 34.3% |
| 2007 | 65.4% | 34.6% |
| 2010 | 64.6% | 35.4% |
Percentage of wealth held in 2000 by the Top 10% of the adult population in various Western countries
| wealth owned by top 10% |
|
|---|---|
| Switzerland | 71.3% |
| United States | 69.8% |
| Denmark | 65.0% |
| France | 61.0% |
| Sweden | 58.6% |
| UK | 56.0% |
| Canada | 53.0% |
| Norway | 50.5% |
| Germany | 44.4% |
| Finland | 42.3% |
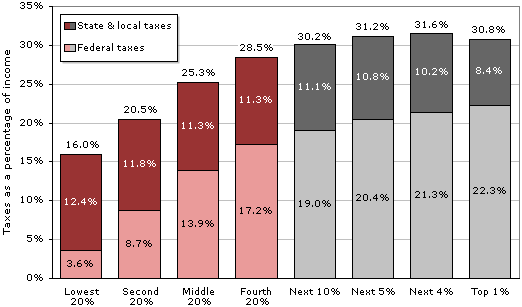
Distribution of Taxes:
When all taxes (not just income taxes) are taken into account:
- The lowest 20% of earners (who average about $12,400 per year) paid 16.0% of their income to various forms of taxes in 2009
- The next 20% (about $25,000/year) paid 20.5% in taxes
- The middle 20% (about $33,400/year) paid 25.3% in taxes
- The next 20%, (about $66,000/year) paid 28.5% in taxes
- The next 10%, (about $100,000/year) paid 30.2% in taxes
- The next 5% ($141,000/year) paid 31.2% in taxes
- The next 4% ($245,000/year) paid 31.6% in taxes
- The top 1% (those who take in $1.3 million per year on average) paid 30.8% of their income to taxes.
Share of income paid as tax, including local and state tax
U.S.A. Income Inequality Compared to Other Countries:
“The degree of income inequality in the United States can be compared to that in other countries on the basis of the Gini coefficient, a mathematical ratio that allows economists to put all countries on a scale with values that range (hypothetically) from zero (everyone in the country has the same income) to 100 (one person in the country has all the income).”
Income equality in selected countries
| Country/Overall Rank | Gini Coefficient |
|---|---|
| 1. Sweden | 23.0 |
| 2. Norway | 25.0 |
| 8. Austria | 26.0 |
| 10. Germany | 27.0 |
| 17. Denmark | 29.0 |
| 25. Australia | 30.5 |
| 34. Italy | 32.0 |
| 35. Canada | 32.1 |
| 37. France | 32.7 |
| 42. Switzerland | 33.7 |
| 43. United Kingdom | 34.0 |
| 45. Egypt | 34.4 |
| 56. India | 36.8 |
| 61. Japan | 38.1 |
| 68. Israel | 39.2 |
| 81. China | 41.5 |
| 82. Russia | 42.3 |
| 90. Iran | 44.5 |
| 93. United States | 45.0 |
| 107. Mexico | 48.2 |
| 125. Brazil | 56.7 |
| 133. South Africa | 65.0 |
To read the entire article, click on Wealth, Income, and Power.
David Cay Johnston in Reuters in October 2011 wrote the following:
- About half of Americans paid no income taxes in 2009
- The top 1 percent of Americans paid about 37 percent of the income taxes
- Households “making less than $75,000 collectively paid more federal income tax than those making $1 million or more”
- Income “taxed at the next-to-lowest rate, 15 percent, brought in more government revenue than all capital gains taxes plus the two top brackets, which apply only to the top 2 percent of earners”
- Almost “half of the top 1 percent made less than $500,000” and five out of six of the top 1% made less than $1 million
- “Someone at the entry point for the top 1 percent would need 29 years to make $10 million, and more than 2,900 years to make $1 billion”
- The “top one-in-a-thousand taxpayers had average income in recent years that ranged between $5.2 million and $7.5 million annually. Just investing that much in corporate bonds will produce enough interest income to keep someone in the top 1 percent.”
- “The top 1 percent paid an average income tax rate of 24 percent in 2009, IRS data shows. That is almost exactly the rate paid by those making $500,000 to $1 million. Those who made $1 million to $10 million paid a higher rate, 26 percent. But those making more than $10 million paid a significantly lower rate, 23.3 percent.”
- “The top 400 taxpayers paid a much lower rate. On an average income of $270 million each, their effective federal income tax rate was 18.1 percent in 2008, the latest year for which we have IRS data. A single worker earning less than $90,000 pays a higher rate than that.”
To read the entire article, click on Beyond the 1 percent.
According to the U.S. Census, 1.9% of all households earn more than $250,000 annually. To view the table, click on Income Distribution to $250,000 or More for Households: 2007.
Sorry, the comment form is closed at this time.