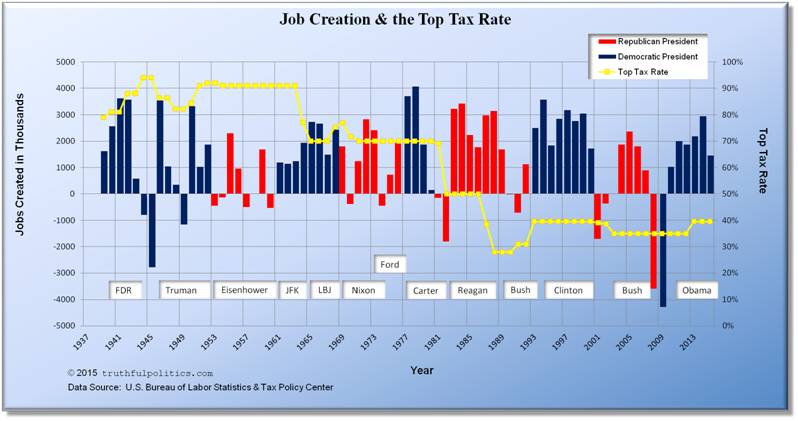
truthful politics reviewed jobs statistics provided by the United States Bureau of Labor Statistics and the top tax rate provided by the Tax Policy Center and the Tax Foundation. The Bureau of Labor Statistics provides the official numbers on jobs gained or lost for the U.S.
- The chart below shows how many jobs annually were created, or lost, nationally during presidential terms and/or political party.
- The numbers are in thousands (i.e., in 1939, 1.6 million jobs were created). To see the raw data on the Bureau’s website, use Series ID CES0000000001.
- Note: Jobs data for 2015 includes numbers through August only. Therefore, full year numbers will be different as September – December are added.
- The chart also shows the top tax rate as a percent (i.e., in 2010, the top tax rate was 35%).
- Blank 1937 and 1938 have been added to make the year markers match presidential terms.
Click on the chart below to see an enlarged, clearer chart.
To read additional information, click on United States Bureau of Labor Statistics, Historical Individual Income Tax Parameters, or the Tax Foundation.
Annaly Salvos in Credit Writedowns in December 2010 reported the following:
- In 1948, the top tax rate was slightly above 80% and the unemployment rate was approximately 4%.
- In the early 1980’s, the top tax rate was 70% and the unemployment rate was approximately 7.5%.
- In 2010, the top tax rate was 35% and the unemployment rate was approximately 9.5%.
- During that same time period, the amount of jobs created (or lost) has stayed roughly the same, between 4 million jobs created during some years and 2 million jobs lost during other years. The largest job losses happened in 2009 when the top tax rate was at 35%, near an all-time low.
To read the entire article and view additional charts, click on Jobs and Taxes.
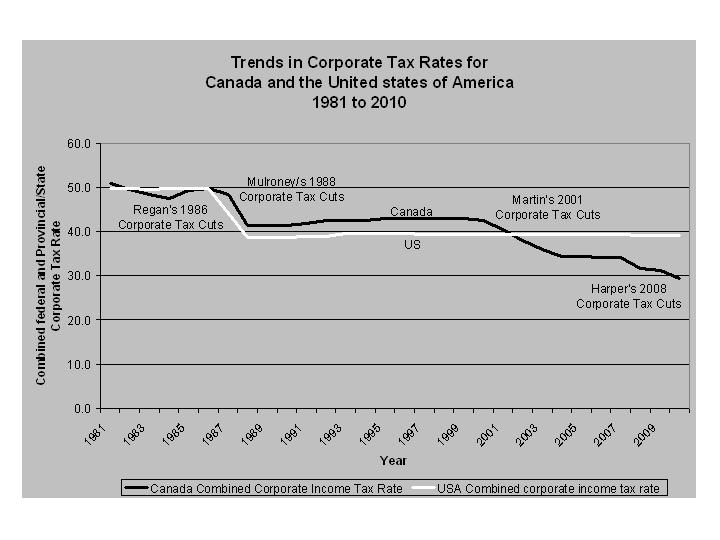
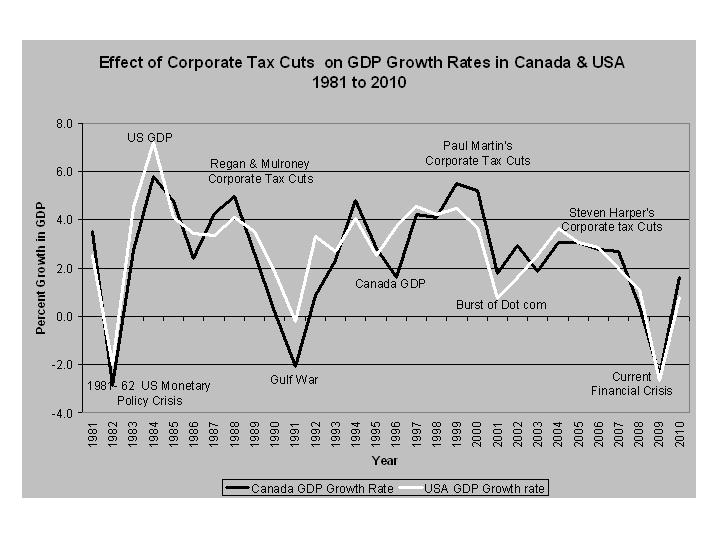
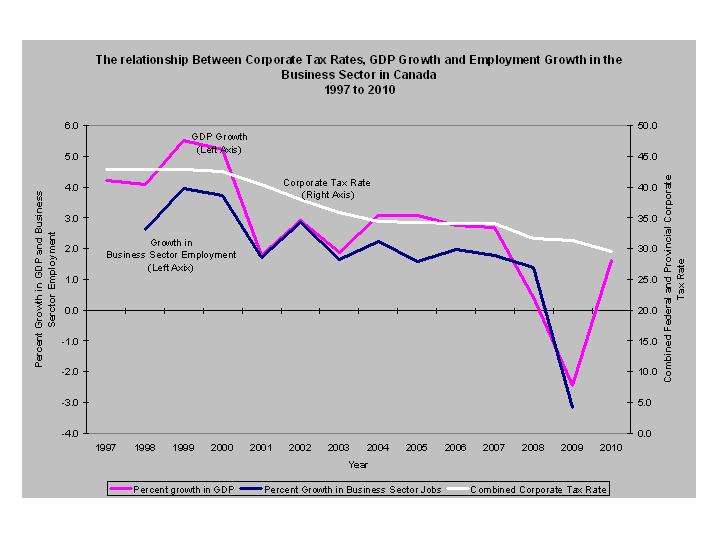
Dr. Brijesh Mathur in April 2011 reported the following:
- From 1981 to 2010, the percent growth rate of the U.S. economy has decreased. The corporate tax rate was reduced in 1987 and has stayed approximately the same since.
- Canada’s corporate tax rate decrease from 45% in 1997 to 30% in 2010.
- During that same time period the percent of growth in business sector employment decreased from 2.5% to 1.5% before becoming negative in 2009.
Click on the chart below to see an enlarged, clearer chart.
Click on the chart below to see an enlarged, clearer chart.
Click on the chart below to see an enlarged, clearer chart.
To read the entire article, click on Do Cuts in Corporate Income Tax Rates Increase GDP Growth and Business Sector Employment? : Three decades of Evidence from Canada & the US.
Craig Jennings in OMB Watch in August 2010 reported the following:
- During the 1990’s, the top tax rate was 39.6% and small business employment rose 2.3%, or 756,000 jobs, annually.
- Between 2001 and 2006, the top tax rate was 35% and small business employment rose 1%, or 367,000 jobs, annually.
- He also displayed the following chart:
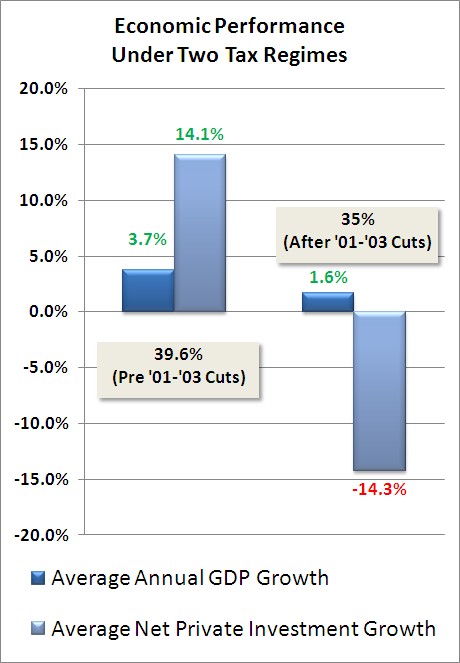
To read the entire article, click on Expiration of High-Income Tax Cuts Probably OK for the Economy.
Sorry, the comment form is closed at this time.