truthful politics reviewed unemployment, labor force participation, and job opening statistics provided by the United States Bureau of Labor Statistics. The Bureau of Labor Statistics provides the official numbers on the above for the U.S. Several charts follow below. All of the charts expand to make the data easier to view. Click on a chart to expand it, and click on the expanded chart to shrink it back to its original size.
The table below lists the average unemployment rate during the tenure of the respective president since 1948.
- The average unemployment rate during Democratic presidents is 5.71%, during Republican presidents 5.93%.
- To view the raw data, use Series ID LNS14000000.
| Unemployment Rate Average During Term | President | Political Party |
| 4.26 | Harry S. Truman | Democratic |
| 4.89 | Dwight D. Eisenhower | Republican |
| 5.97 | John F. Kennedy | Democratic |
| 4.17 | Lyndon B. Johnson | Democratic |
| 5.09 | Richard Nixon | Republican |
| 8.09 | Gerald Ford | Republican |
| 6.54 | Jimmy Carter | Democratic |
| 7.54 | Ronald Reagan | Republican |
| 6.30 | George H. W. Bush | Republican |
| 5.20 | Bill Clinton | Democratic |
| 5.27 | George W. Bush | Republican |
| 7.82 | Barack H. Obama | Democratic |
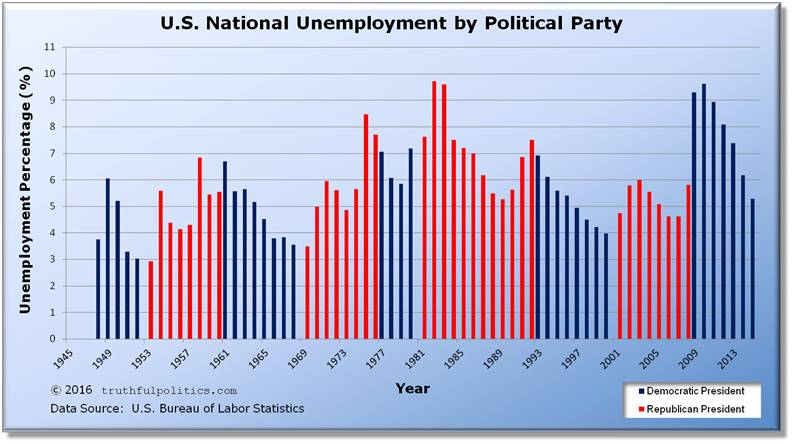
The chart below shows the average unemployment rate each year.
- Blank years of 1945, 1946, and 1947 have been added to make the year markers match presidential terms.
- To view the raw data, use Series ID LNS14000000.
Click on the chart below to see an enlarged, clearer chart.
The chart below shows the average labor force participation rate each year.
- To view the raw data, use Series ID LNS11300000.
- Blank years of 1945, 1946, and 1947 have been added to make the year markers match presidential terms.
Click on the chart below to see an enlarged, clearer chart.

The chart below shows the average amount of job openings each year.
- To see the raw data on the Bureau’s website, use Series ID JTS00000000JOL.
- For example, the average amount of job openings in 2001 was 4.28 million.
Click on the chart below to see an enlarged, clearer chart.

To read additional information and/or review the source data, click on United States Bureau of Labor Statistics.
Daily Kos had a blog from September of 2008 by linuxguy. The following chart ranks presidents and political parties from reducing unemployment the most to reducing unemployment the least.
Unemployment Rate, U.S. Department of Labor: Bureau of Labor Statistics
period start end chng President Party
Jan 1993 Jan 1997 7.3 5.3 -2.0 Clinton I Democrat
Jan 1985 Jan 1989 7.3 5.4 -1.9 Reagan II Republican
Jan 1961 Jan 1965 6.6 4.9 -1.7 JFK/Johnson Democrat
Jan 1965 Jan 1969 4.9 3.4 -1.5 Johnson Democrat
Jan 1949 Jan 1953 4.3 2.9 -1.4 Truman Democrat
Jan 1997 Jan 2001 5.3 4.2 -1.1 Clinton II Democrat
Jan 1981 Jan 1985 7.5 7.3 -0.2 Reagan I Republican
Jan 1977 Jan 1981 7.5 7.5 0.0 Carter Democrat
Jan 2005 Aug 2008 5.2 6.1 +0.9 Bush, GW II Republican
Jan 2001 Jan 2005 4.2 5.2 +1.0 Bush, GW I Republican
Jan 1953 Jan 1957 2.9 4.2 +1.3 Eisenhower I Republican
Jan 1969 Jan 1973 3.4 4.9 +1.5 Nixon Republican
Jan 1989 Jan 1993 5.4 7.3 +1.9 Bush, GHW Republican
Jan 1957 Jan 1961 4.2 6.6 +2.4 Eisenhower II Republican
Jan 1973 Jan 1977 4.9 7.5 +2.6 Nixon/Ford Republican
To read the entire article, click on Unemployment Rate by President and Party.
Sorry, the comment form is closed at this time.