truthful politics reviewed jobs statistics provided by the United States Bureau of Labor Statistics. The Bureau of Labor Statistics provides the official numbers on jobs gained or lost for the U.S.
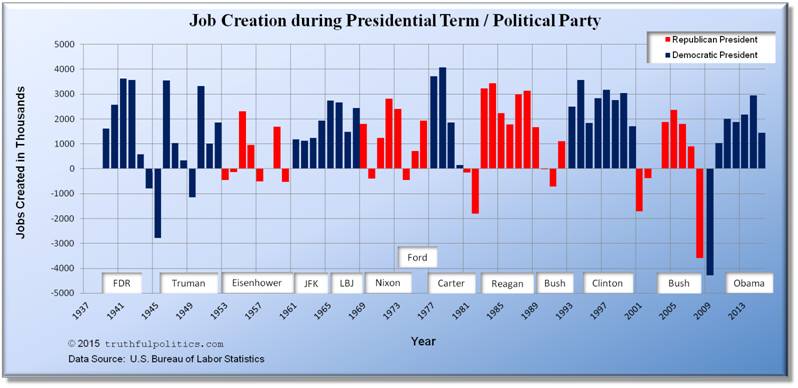
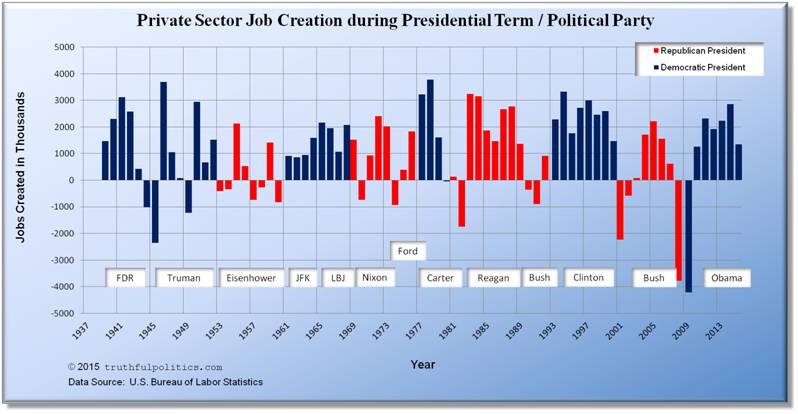
- Both charts below show how many jobs annually were created, or lost, nationally during presidential terms and/or political party. The numbers are in thousands.
- Blank 1937 and 1938 have been added to make the year markers match presidential terms.
- Note: In both charts, data for 2015 includes numbers through August only. Therefore, full year numbers will be different as September – December are added.
- The first chart displays all jobs, including government sector jobs (i.e., in 1939, approximately 1.6 million jobs were created). To see the raw data on the Bureau’s website, use Series ID CES0000000001.
- The second chart displays all private sector jobs; government sector jobs are NOT included (i.e., in 1939, approximately 1.5 million jobs were created). To see the raw data on the Bureau’s website, use Series ID CES0500000001.
- The average amount of all jobs created during Democratic Presidential terms is 1,748,610 and the average amount during Republican Presidential terms is 880,500.
- The average amount of private sector jobs created during Democratic Presidential terms is 1,536,560 and the average amount during Republican Presidential terms is 650,330.
- Therefore, the average amount of non-private sector jobs created during Democratic Presidential terms is 212,050 and the average amount during Republican Presidential terms is 230,170.
Click on the chart below to see an enlarged, clearer chart.
Click on the chart below to see an enlarged, clearer chart.
The table below lists the amount of private sector jobs created in thousands during each President’s tenure. Again, this table displays all private sector jobs; government sector jobs are NOT included (i.e., during the years Harry S. Truman was President (1946 – 1952), approximately 8.78 million private sector jobs were created). To see the raw data on the U.S. Bureau of Labor Statistics’ website, use Series ID CES0500000001.
| Jobs Created in Thousands | President | Political Party |
| 6,566 | Franklin D. Roosevelt | Democrat |
| 8,781 | Harry S. Truman | Democrat |
| 1,556 | Dwight D. Eisenhower | Republican |
| 2,729 | John F. Kennedy | Democrat |
| 8,895 | Lyndon B. Johnson | Democrat |
| 5,254 | Richard Nixon | Republican |
| 2,235 | Gerald Ford | Republican |
| 8,601 | Jimmy Carter | Democrat |
| 13,621 | Ronald Reagan | Republican |
| 1,084 | George H. W. Bush | Republican |
| 19,662 | Bill Clinton | Democrat |
| -338 | George W. Bush | Republican |
| 7,765 | Barack Obama | Democrat |
To read additional information, click on United States Bureau of Labor Statistics.
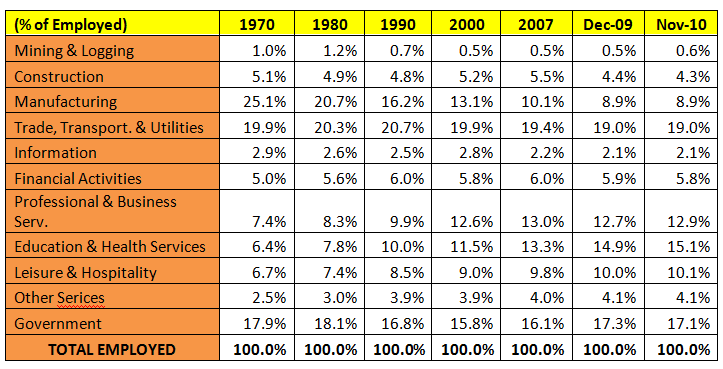
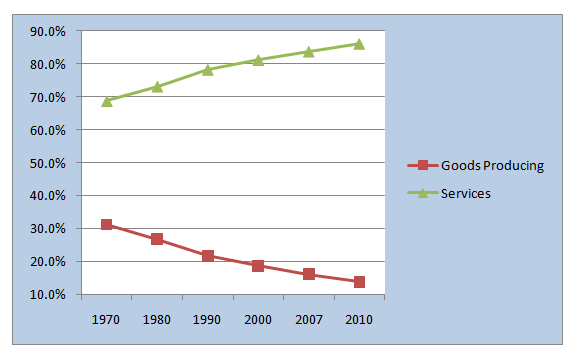
James Quinn in The Market Oracle in January 2011 displayed the following charts:
Click on the chart below to see an enlarged, clearer chart.
Click on the chart below to see an enlarged, clearer chart.
Click on the chart below to see an enlarged, clearer chart.
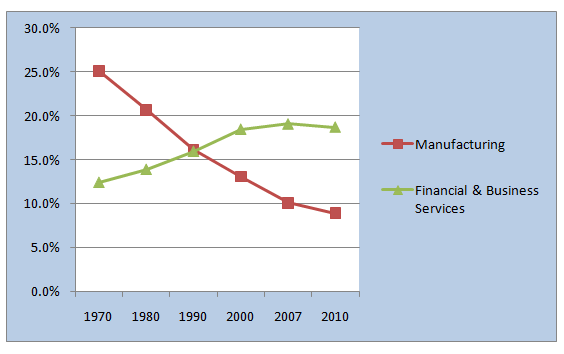
To read the entire article, click on U.S. Propaganda Ministers Pumping Out Jobs Recovery Propaganda.
David Fiderer in The Huffington Post in September 2008 compared job creation under Democratic and Republican presidential terms. “Since Truman was elected in 1948, 53.2 million new jobs were created during the 24 years when Democrats held The White House, and 38.3 million were created during the 36 years of Republican administrations.”
| President | Years in Office | Millions of Jobs Added |
| Truman | 1949 – 1952 | 5.2 |
|
Eisenhower
|
1953 – 1956
|
2.7 |
| Kennedy/Johnson | 1961 – 1964 | 5.7 |
| Johnson | 1965 – 1968 | 9.8 |
| Nixon | 1969 – 1972 | 6.1 |
| Nixon/Ford | 1972 – 1976 | 5.2 |
| Carter |
1977 – 1980
|
10.4 |
| Reagan | 1981 – 1984 | 5.2 |
| Reagan | 1985 – 1988 | 10.8 |
| Bush | 1989 – 1992 | 2.5 |
| Clinton | 1993 – 1996 | 11.6 |
| Clinton | 1997 – 2000 | 11.5 |
| Bush | 2001 – 2004 | (0.1) |
| Bush | 2005 – 2008 | 5.1 |
To read the entire article, click on The Simple Arithmetic of Employment: Job Growth Is Always Higher When a Democrat Is In The White House.
Wikipedia has a table with job gain/loss totals by president and political party. In the “Party” column, “R” means Republican President and “D” means Democratic President.
| U.S. President | Party | Term years | Start jobs (Jan) |
Start jobs (Sept) |
End jobs (Jan) |
End jobs (Sept) |
Created (Jan) |
Created (Sept) |
| Harding/Coolidge | R | 1921–1925 | 25,000 ** | 29,500 ** | +4,500 ** | |||
| Calvin Coolidge | R | 1925–1929 | 29,500 ** | 32,100 ** | +2,600 ** | |||
| Herbert Hoover | R | 1929–1933 | 32,100 ** | 25,700 ** | -6,400 ** | |||
| Franklin Roosevelt | D | 1933–1937 | 25,700 ** | 31,200 ** | +5,500 ** | |||
| Franklin Roosevelt | D | 1937–1941 | 31,200 ** | 34,480 | 37,836 | +3,280 ** | ||
| Franklin Roosevelt | D | 1941–1945 | 34,480 | 37,836 | 41,903 | 38,500 | +7,423 | +664 |
| Roosevelt/Truman | D | 1945–1949 | 41,903 | 38,500 | 44,675 | 43,784 | +2,772 | +5,284 |
| Harry Truman | D | 1949–1953 | 44,675 | 43,784 | 50,145 | 50,365 | +5,470 | +6,581 |
| Dwight Eisenhower | R | 1953–1957 | 50,145 | 50,365 | 52,888 | 52,932 | +2,743 | +2,567 |
| Dwight Eisenhower | R | 1957–1961 | 52,888 | 52,932 | 53,683 | 54,387 | +795 | +1,455 |
| Kennedy/Johnson | D | 1961–1965 | 53,683 | 54,387 | 59,583 | 61,490 | +5,900 | +7,103 |
| Lyndon Johnson | D | 1965–1969 | 59,583 | 61,490 | 69,438 | 70,918 | +9,855 | +9,428 |
| Richard Nixon | R | 1969–1973 | 69,438 | 70,918 | 76,290 | 77,281 | +6,852 | +6,363 |
| Nixon/Ford | R | 1973–1977 | 76,290 | 77,281 | 80,237 | 83,532 | +3,947 | +6,251 |
| Jimmy Carter | D | 1977–1981 | 80,692 | 83,532 | 91,031 | 91,471 | +10,339 | +7,939 |
| Ronald Reagan | R | 1981–1985 | 91,031 | 91,471 | 96,353 | 98,023 | +5,322 | +6,552 |
| Ronald Reagan | R | 1985–1989 | 96,353 | 98,023 | 107,133 | 108,326 | +10,780 | +10,303 |
| George H. W. Bush | R | 1989–1993 | 107,133 | 108,326 | 109,805 | 111,358 | +2,672 | +3,032 |
| Bill Clinton | D | 1993–1997 | 109,805 | 111,360 | 121,381 | 123,418 | +11,576 | +12,060 |
| Bill Clinton | D | 1997–2001 | 121,381 | 123,418 | 132,696 | 131,524 | +11,315 | +8,106 |
| George W. Bush | R | 2001–2005 | 132,696 | 131,524 | 132,752 | 134,240 | +56 | +2,716 |
| George W. Bush | R | 2005–2009 | 132,752 | 134,240 | 133,977 | 129,734 | +1,225 | -4,506 |
| Barack Obama | D | 2009–2013 | 133,977 | 129,734 | 135,293 | 131,694 (through 2011) |
+1,316 | +1,960 (through 2011) |
| Barack Obama | D | 2013–2015 | 135,293 | 142,246 | +6,953 |
| U.S. President | Party | Ave annual increase (Jan) |
| Harding/Coolidge | R | +4.23% |
| Calvin Coolidge | R | +2.13% |
| Herbert Hoover | R | -5.41% |
| Franklin Roosevelt | D | +4.97% |
| Franklin Roosevelt | D | +2.53% |
| Franklin Roosevelt | D | +5.00% |
| Roosevelt/Truman | D | +1.61% |
| Harry Truman | D | +2.93% |
| Dwight Eisenhower | R | +1.34% |
| Dwight Eisenhower | R | +0.87% |
| Kennedy/Johnson | D | +2.64% |
| Lyndon Johnson | D | +3.90% |
| Richard Nixon | R | +2.38% |
| Nixon/Ford | R | +1.29% |
| Jimmy Carter | D | +3.06% |
| Ronald Reagan | R | +1.43% |
| Ronald Reagan | R | +2.69% |
| George H. W. Bush | R | +0.62% |
| Bill Clinton | D | +2.64% |
| Bill Clinton | D | +2.33% |
| George W. Bush | R | +0.01% |
| George W. Bush | R | +0.23% |
| Barack Obama | D | +0.25% |
| Barack Obama | D | +2.00% |
To read the entire article, click on Jobs created during U.S. presidential terms. Lastly, Data Politica also has charts on job gains/losses. To view the chart, click on Monthly U.S. Jobs Created 1988-Present including Political Party and President.
Sorry, the comment form is closed at this time.