Below are statistics from several sources on if cutting taxes increase or decrease government revenue, or tax receipts. The first chart shows government revenue as a percentage of the economy, or Gross Domestic Product (GDP). The major tax cuts occurred in 1918 – 1925, 1964, 1981, 2001, and 2003.
Click on the chart below to see an enlarged, clearer chart.
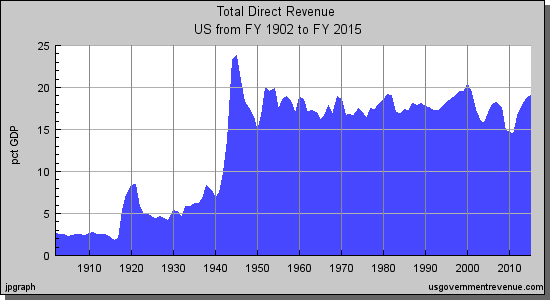
For additional data, click on usgovernmentrevenue.com.
In the Bonddad Blog, information is available about cutting taxes for either the wealthy or the lower income classes.
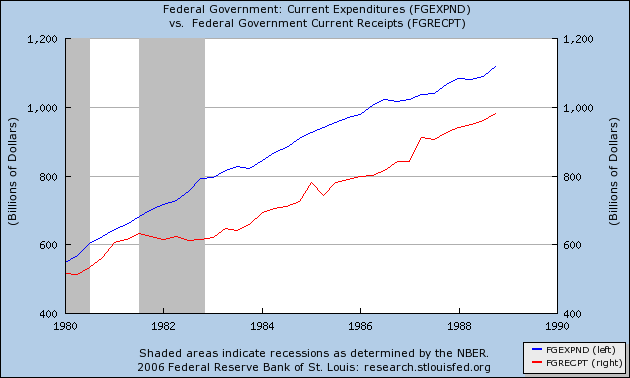
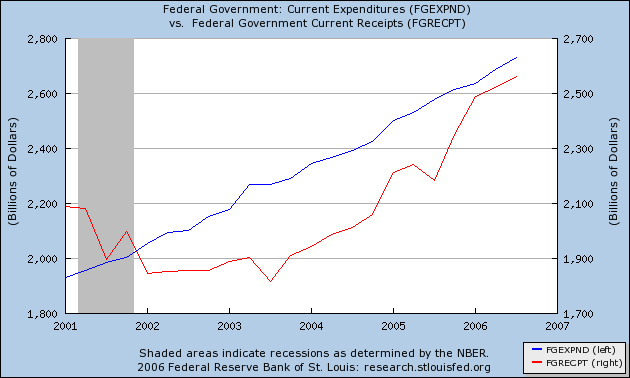
- The following charts show government expenditures and government revenue during the 1980’s and the 2000’s.
- Tax cuts were enacted in the early 1980’s and early 2000’s.
- The blog concludes saying “the growth achieved is insufficient to stimulate the economy to high enough levels to make-up for the loss in revenue.”
Click on the chart below to see an enlarged, clearer chart.
Click on the chart below to see an enlarged, clearer chart.
To read the entire article, click on The Complete Failure of Supply-Side Economics.
Factcheck.org in June 2007 reported the following about tax cuts in 2001 and 2003 and the correlation with increased tax revenues:
- “Federal revenue normally increases every year. In fact, revenues have declined in only five years since 1962.”
- Tax revenues from 2000 to 2003 actually declined every year.
- Tax revenues started to increase in 2004. The Office of Management and Budget described the increase in tax revenue in the years 2004-2006 as a return to the historical average. “As a percentage of GDP, federal receipts are now 18.4 percent of GDP (in line with the 40-year historical average of 18.3 percent).”
- “The bulk of the growth in federal receipts has been in corporate tax revenue.”
To read the entire article, click on Supply-side Spin.
Daniel Mitchell in The New York Times in February 2002 said the following:
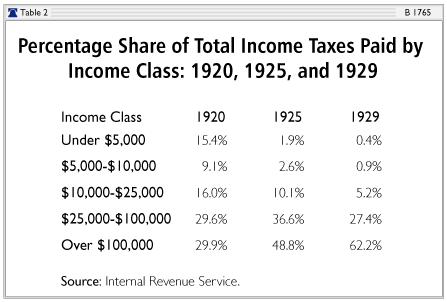
- “In the 1960’s, President John F. Kennedy cut the top rate to 70 percent from 91 percent. Between 1961 and 1968, as the economy expanded by more than 42 percent and tax revenues rose by one-third, the rich saw their share of the tax burden climb to 15.1 percent from 11.6 percent.”
- “In the 1980’s, the top marginal rate was cut to 28 percent from 70 percent. Critics charge that this caused higher federal budget deficits, but they misread the evidence. Although the Reagan tax cut was approved in 1981, it was phased in slowly (much as the Bush tax cut is scheduled to be). Once the cuts were in place, the economy grew and tax revenues soared. Revenues from personal income taxes increased 28 percent (adjusted for inflation) by 1989. And yes, the rich wound up paying more. The share paid by the top 10 percent jumped to 57.2 percent from 48 percent of total income tax revenues. The share for the top 1 percent rose to 27.5 percent in 1988 from 17.6 percent in 1981.”
The entire article may be read by clicking on Cutting Taxes Faster Would Help Everyone.
Stephen Moore in The Wall Street Journal in June 2005 said the following:
“Earlier this month the Congressional Budget Office released its latest report on tax revenue collections. The numbers are an eye-popping vindication of the Laffer Curve and the Bush tax cut’s real economic value. Federal tax revenues surged in the first eight months of this fiscal year by $187 billion. This represents a 15.4% rise in federal tax receipts over 2004. Individual and corporate income tax receipts have exploded like a cap let off a geyser, up 30% in the two years since the tax cut. Once again, tax rate cuts have created a virtuous chain reaction of higher economic growth, more jobs, higher corporate profits, and finally more tax receipts.”
The entire article can be read by clicking Real Tax Cuts Have Curves.
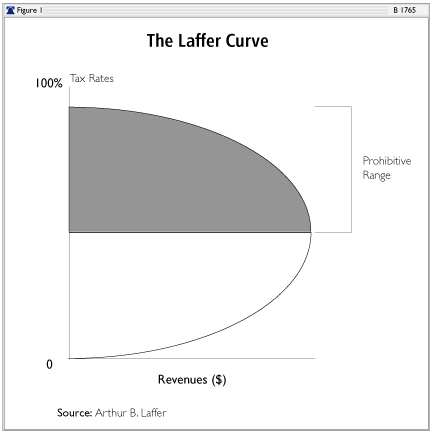
The Heritage Foundation has an article describing the Laffer Curve.
The following graph describes the Laffer Curve:
The following graph illustrates the top income tax rate over time:
Click on the chart below to see an enlarged, clearer chart.
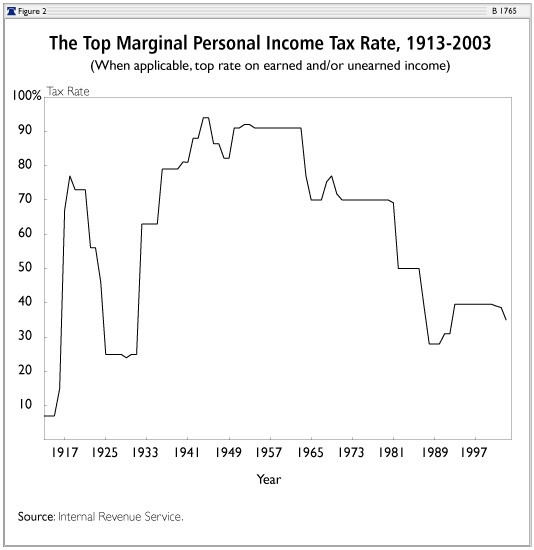
The Harding-Coolidge tax cuts decreased the top marginal tax rate from 77% in 1918 to 25% by 1925. The Heritage Foundation says that “over the four years following the tax-rate cuts, revenues remained volatile but averaged an inflation-adjusted gain of 0.1 percent per year. The economy responded strongly to the tax cuts, with output nearly doubling and unemployment falling sharply.”
The following graph illustrates the percentage of total income taxes paid by different income brackets:
The Kennedy tax cut in 1964 decreased the top marginal personal income tax rate from 91 percent to 70 percent. The Heritage Foundation says that “in the four years following the tax cut, federal government income tax revenue increased by 8.6 percent annually and total government income tax revenue increased by 9.0 percent annually. Government income tax revenue not only increased in the years following the tax cut, it increased at a much faster rate.”
The Economic Recovery Tax Act of 1981, signed into law under President Reagan reduced several different tax rates. The Heritage Foundation says that “between 1978 and 1982, the economy grew at a 0.9 percent annual rate in real terms, but from 1983 to 1986 this annual growth rate increased to 4.8 percent.” The Foundation continued, “the unemployment rate, which peaked at 9.7 percent in 1982, began a steady decline, reaching 7.0 percent by 1986 and 5.3 percent when Reagan left office in January 1989” and “between 1983 and 1986, federal income tax revenue increased by 2.7 percent annually, and total government income tax revenue increased by 3.5 percent annually.”
To read the entire article, click on The Laffer Curve: Past, Present, and Future.
Sorry, the comment form is closed at this time.