truthfulpolitics.com

Oct 082010
 
Share

Anna J. Schwartz in The Concise Encyclopedia of Economics in 2008 defined the U.S. money supply as the total of the currency, bills and coins, and various kinds of deposits that are close substitutes of money held at banks, credit unions, etc. The Federal Reserve predominately affects the money supply and does so by affecting bank deposits.

  • The Federal Reserve requires banks and credit unions (called depository institutions) to hold as reserves a percentage of the their deposits.
  • Therefore, if the required reserve percentage is 10%, if a bank has $1,000, it has to keep $100 deposited and can lend the remainder of $900. This required reserve percentage is called the reserve ratio is 10 percent.
  • The $900 will then get deposited in either the same bank or another bank. And then, the process continues. Bank B will now have an additional deposit of $900. 10% is $90, which must be kept in reserves.
  • Therefore, Bank B may lend out $810.
  • The process continues until the maximum amount of new loans is reached which is ten times the initial amount of excess reserve, or $9,000: 900 + 810 + 729 + 656.1 + 590.5, etc.
  • Therefore, from the original $1,000 in deposits, adds $9,000 to the money supply.
  • This system is called fractional reserve banking. An “increase in bank reserves can support a multiple expansion of deposits, and a decrease can result in a multiple contraction of deposits.”
  • Since 1914, a decline in the money supply has occured 3 times, “each of which was severe as judged by the decline in output and rise in unemployment: 1920-1921, 1929-1933, and 1937-1938. The severity of the economic decline in each of these cyclical downturns, it is widely accepted, was a consequence of the reduction in the quantity of money, particularly so for the downturn that began in 1929, when the quantity of money fell by an unprecedented one-third. There have been no sustained declines in the quantity of money in the past six decades.”
  • “The United States has experienced three major price inflations since 1914, and each has been preceded and accompanied by a corresponding increase in the rate of growth of the money supply: 1914-1920, 1939-1948, and 1967-1980. An acceleration of money growth in excess of real output growth has invariably produced inflation-in these episodes and in many earlier examples in the United States and elsewhere in the world.”

To read the entire article, click on Money Supply.
Oct 082010
 
Share

Measuring Worth provides calculations to determine the value of the U.S. dollar in history compared to now:

  • George Washington, the first president of the United State of America, had a salary of $25,000 from 1789 to 1797. As a share of GDP, or Gross Domestic Product, “his salary as a share of GDP would rank him equivalent to $1.8 billion”
  • The Eerie Canal, built between 1817 and 1825, cost $7 million. As a fraction of GDP, the cost equates to approximately $120 billion. The current budget of the U.S. Department of transportation is $60 billion.
  • The Civil War occurred between 1861 and 1865 costing $6.7 billion. As a share of GDP, $6.7 billion would be $21 trillion today.
  • The Ford Model T cost $290 in 1925. The cost in 2007 is $17,000 when comparing its cost as a share of GDP per capita.
  • The cost of the Apollo Program, a 13 year program, to put a man on the moon cost between $20 and $25 billion. As a percent of GDP that number would be $390 billion, approximately $30 billion per year. The NASA budget for the current (2007) fiscal year is approximately $15 billion.

To read additional information on the relative value of the U.S. dollar, click on Six Ways to Compute the Relative Value of a U.S. Dollar Amount, 1774 to Present.

Oct 082010
 
Share

The FDIC stands for the Federal Deposit Insurance Corporation. As of December 2007, it had $52.4 billion in reserves (the insurance fund) (audited) and as of March 2008, it had $52.8 billion. To read the FDIC financial reports, click on FDIC’s annual and financial reports.

Alison Vekshin in Bloomberg in August 2008 mentioned the following:

  • The FDIC is required to increase its insurance fund when the reserve ratio, or the balance divided by the insured deposits, falls below 1.15 percent, or if the reserve ratio is expected to fall below that 1.15% within six months. “A 2006 law directs the agency to take steps to reach the 1.15 percent ratio within five years.”
  • The FDIC adds money to its insurance fund through premiums charged to banks. In 2007, the premiums charged to banks averaged 5.4 cents per $100 of insured deposits. “Troubled banks pay higher rates.”
  • “The FDIC insured $4.43 trillion in deposits as of March 31,” 2008.

To read the entire report, click on FDIC Fund Strained by Bank Failures May Lift Premiums (Update2).


For information on other economic collapses, click on Previous Economic Collapses.

Oct 082010
 
Share

Modern Money Mechanics

The Federal Reserve Bank of Chicago published Modern Money Mechanics describing bank reserves, deposit expansion, and how the U.S. money system works. The following websites contain digital versions of the workbook: Modern Money Mechanics on Scribd, Modern Money Mechanics on Internet Archive.


Two Faces of Debt

The Federal Reserve Bank of Chicago published Two Faces of Debt describing the risks associated with debt and role it plays in creating productive investments. The following website contains a digital version of the booklet: Two Faces of Debt on Scribd.


Public Debt: Private Asset

The Federal Reserve Bank of Chicago published Public Debt: Private Asset describing the federal government debt and the economy. The following websites contain digital versions of the booklet: Public Debt: Private Asset. Government Debt and Its Role in the Economy on Education Resources Information Center (ERIC), Public Debt: Private Asset. Government Debt and Its Role in the Economy on Education Resources Information Center (ERIC), and Public Debt: Private Asset. Government Debt and Its Role in the Economy on truthful politics.

Oct 082010
 
Share

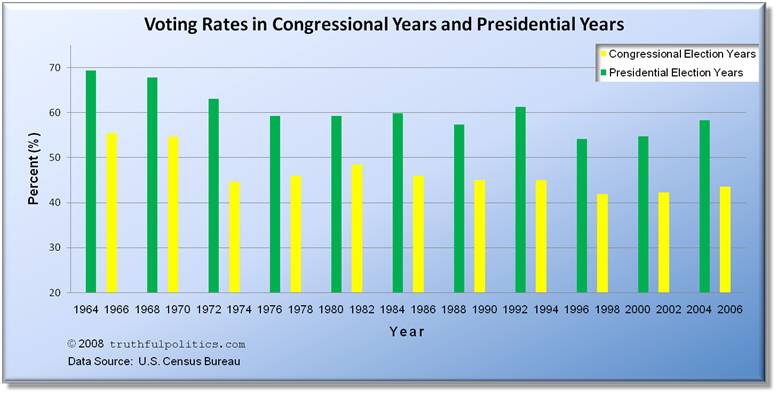
Click on the chart below to see an enlarged, clearer chart.

Voting Rates in Congressional Years and Presidential Years


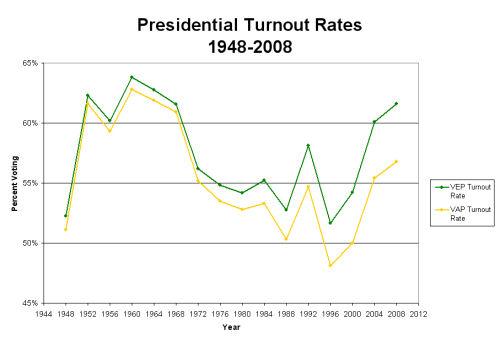
George Mason University, in it’s United States Elections Project also illustrates presidential voter turnout rates.

  • VEP stands for voting-eligible population and is the percentage of those eligible to vote to those that do vote.
  • VAP stands for voting-age population and is the percentage of those over the age of 18 to those that do vote. According to George Mason University, VAP also includes “includes persons ineligible to vote, mainly non-citizens and ineligible felons, and excludes overseas eligible voters.”

Presidential Turnout Rates from 1948-2008

For additional information, click on United States Elections Project.


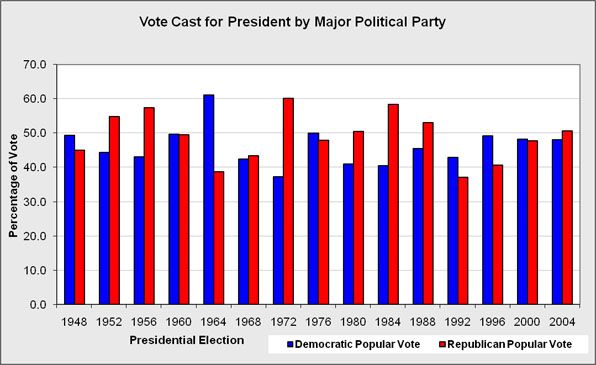
Project America illustrates voting percentage by political party:

Click on the chart below to see an enlarged, clearer chart.

Vote Cast for President by Major Political Party

For additional information, click on Vote Cast for President by Major Political Party.

Oct 082010
 
Share

The Milken Institute in October 2007 also performed a study on the cost of chronic disease to the U.S. economy. The report covered seven common chronic diseases: cancers, diabetes, heart disease, hypertension, stroke, mental disorders, and pulmonary conditions. Their major findings included:

  • The economic impact in the U.S. in 2003 (in billions of dollars) for Treatment Expenditures: $277
  • The economic impact in the U.S. in 2003 (in billions of dollars) for Lost Productivity: $1,047
  • Therefore, the total annual economic loss: $1,324
  • “Reasonable improvements in preventing and managing chronic disease could reduce future economic costs of disease in the United States sharply, by 27% ($1.1 trillion) in 2023. $905 billion of this would come from gains in productivity, and $218 billion would come from reduced treatment spending.”

To read the entire report, click on An Unhealthy America: The Economic Burden of Chronic Disease.

Oct 082010
 
Share

The Henry J. Kaiser Family Foundation in May 2002 performed a study on the cost of not covering the uninsured and the consequences of being uninsured. Their major findings included:

  • Health insurance reduces mortality rates, meaning a person with health insurance will have a longer lifespan, by 10-15%.
  • “The combination of less ability to work and lower productivity resulting from poor health has been estimated to reduce earnings by between 10 and 28%, depending on race and gender, over a 10-year period.”
  • Through the national health insurance program, expanding health insurance coverage in Canada reduced infant mortality, the number of deaths of children under the age of 1, by about 4%.
  • “The uninsured are 30-50% more likely to be hospitalized for an avoidable condition.”
  • “The average cost of an avoidable hospital stay in 2002 is estimated to be about $3,300.”

To read the entire report, click on Sicker And Poorer: The Consequences of Being Uninsured.


The Institute of Medicine of the National Academies in 2003 also performed a study on the cost of not covering the uninsured and the consequences of being uninsured. Their major findings included:

  • “Americans devote more economic resources to health care than people in any other nation in the world, both in total dollars spent ($1.236 trillion for personal health care services in 2001) and as a percent of the gross domestic product (14 percent)”
  • The uninsured poppulation have a 25% higher mortality rate
  • The estimated “economic value of the healthier and longer life that an uninsured child or adult forgoes because he or she lacks health insurance ranges between $1,645 and $3,280 for each additional year spent without coverage”
  • The “aggregate, annualized cost of the diminished health and shorter life spans of Americans who lack health insurance is between $65 and $130 billion for each year of health insurance forgone”
  • “The total cost of health care services used by individuals who are uninsured for either part of or the entire year is estimated to be $98.9 billion for 2001”
  • “The best available estimate of the value of uncompensated health care services provided to persons who lack health insurance for some or all of a year is roughly $35 billion annually, about 2.8 percent of total national spending for personal health care services”

To read the entire report, clicking on Hidden Costs, Value Lost: Uninsurance in America.


The New America Foundation in November 2008 also performed a study on the cost of not covering the uninsured and the consequences of being uninsured. Their major findings included:

  • “In 2006, our economy lost as much as $200 billion because of the poor health and shorter lifespan of the uninsured”
  • “The economies in California, Texas, and Florida suffer most from productivity loses stemming from the uninsured. Yet, Delaware’s economy loses more per uninsured person — over $6,800 per uninsured resident.”
  • “The cost of the average employer-sponsored health insurance plan (ESI) for a family will reach $24,000 in 2016. This represents an 84 percent increase over 2008 premium levels.”
  • “Under this scenario, we estimate that at least half of American households will need to spend more than 45 percent of their income to buy health insurance.”

To read the entire report, click on The Cost of Doing Nothing.

Oct 082010
 
Share

Researchers at the Kellogg School mentioned that “medical expenses contribute to less than 20 percent of all bankruptcies.” To read the entire article, click on Medical Costs Contribute To Fewer Than One In Five Bankruptcies, Say Kellogg Management School Researchers.

Researchers at Northwestern University mentioned that “medical bills are a contributing factor in just 17 percent of personal bankruptcies.” To read the entire article, click on Medical Bankruptcy: Myth vs. Fact.


Factcheck.org had the following statistics:

  • A Harvard Study from 2005 mentioned 46.2% of bankruptcies attributed to medical reasons
  • American Bankruptcy Institute in 1996 mentioned 57% of filers said medical reasons were the major cause of their bankruptcy

To read the entire article, click on What is the percentage of total personal bankruptcies caused by health care bills?

NPR in 2002 mentioned the following statistics of households contacted by a collection agency in the past year:

  • 27% of households earning less than $25,000 annually
  • 12% of households earning between $25,000 and $50,000 annually
  • 4% of households earning greater than $50,000 annually

To read the entire article, click on NPR/Kaiser/Kennedy School Poll on Health Care.