truthfulpolitics.com

Oct 172010
 
Share

Transparency International annually reports the Corruption Perceptions Index (CPI) which “measures the perceived levels of public sector corruption in 180 countries and territories. A composite index, the CPI is based on 13 different expert and business surveys.” For 2009, New Zealand ranked #1 where corruption is perceived to be smallest, whereas Somalia ranked #180 where corruption is perceived to be greatest. The United States ranked #19.

To read the entire report, click on Corruption Perceptions Index 2009.
Oct 162010
 
Share

Nauro F. Campos in Vox in November 2008 presented the following:

  • Lobbying “is a very important alternative instrument of political influence” in transition economies (economies in developing countries).
  • The effect of lobbying in producing political influence “is always statistically significant, while that of corruption seldom is.”
  • The “size of the effect of lobbying on political influence is always substantially larger than that of corruption (and this is irrespective of whether the ‘target’ is the executive, the legislative, the ministries, or the regulatory agencies).”
  • “These findings support the notion that lobbying seems to be a considerably a more effective way for firms to exert political influence than corruption, even in poor, developing countries that are often perceived as highly corrupt.”
  • Firms “that favour lobbying tend to be in countries that are politically more stable, more democratic, more likely to be federal states, have a more independent media, and which have experienced more alternations in political leadership”.
  • Corruption “is more prevalent in countries where the electoral system does not feature closed lists and has larger electoral districts, where the media is less independent, where the executive has more veto powers, and among smaller and domestically-owned firms.”
  • Lobbying “is also a much stronger explanatory factor for firm performance (measured as sales growth) than corruption.”

To read the entire article, click on Corruption happens, lobbying rules.

Oct 162010
 
Share

Sharon Jayson in USA Today in November 2009 reported the following:

  • In the 2000 Census, one “in five male couples and one in three lesbian couples were raising children.”
  • In the 1990 Census, the numbers were “one in 20 male couples and one in five lesbian couples” were raising children.
  • The “2008 American Community Survey showed that 31% of same-sex couples who identify themselves as spouses are raising kids compared with 43% of heterosexual couples.”
  • “The transition to parenthood is similar for both homosexual couples and heterosexual couples.”
  • “Children of gay couples don’t differ from their peers raised by heterosexual couples in terms of their mental health, self-esteem, life satisfaction, social skills or number of friends.”
  • “Children in gay families are teased more about their families and their sexuality but are not teased more overall.”

To read the entire article, click on Gay couples: A close look at this modern family, parenting.

Oct 142010
 
Share

Hope Yen in USAToday in September 2009 reported the following:

  • “The wealthiest 10% of Americans – those making more than $138,000 a year – earned 11.4 times the $12,000 or so made by those living near or below the poverty line in 2008, according to newly released census figures. That ratio is an increase from 11.2 in 2007 and the previous high o[f ]11.22 in 2003.”
  • “Median income fell last year from $52,163 to $50,303, wiping out a decade’s worth of gains to hit the lowest level since 1997. the median is the midpoint – half of households made more, half less.”
  • Poverty increased to an 11-year high of 13.2%.
  • “Income at the top 5% of households – those making $180,000 or more – was 3.58 times the median income, highest since 2006.”

To read the entire article, click on Recession pushes income gap between rich, poor to record.

Oct 132010
 
Share

Andrew Romano in Newsweek in May 2010 reported on the past five Republican presidents, Richard Nixon, Gerald Ford, Ronald Reagan, George H.W. Bush, and George W. Bush and if they could satisfy today’s Republican base.

  • Richard Nixon
    • In 1969, he introduced the only balanced budget between 1961 and 1998.
    • “He indexed Social Security for inflation, which, along with increased Medicare spending, helped boost government benefits from 6.3 percent of the Gross National Product (GNP) to 8.9 percent over the course of his administration.”
    • “The top tax rate went up during Nixon’s first three years in office.”
    • He signed the National Environmental Policy Act, the Clean Air Act of 1970, and the Federal Water Pollution Control Act amendments of 1972
    • He established the Environmental Protection Agency (EPA) and the Council on Environmental Quality
    • He introduced a comprehensive health-insurance-reform bill that included an individual mandate and called for a government-run “public option”.
    • He “he slashed defense spending from 9.1 percent to 5.8 percent of GNP”.
  • Gerald Ford
    • Cut “off all aid to Jerusalem for six months between March and September of 1975”.
    • When discussing abortion, he “called himself ‘pro-choice’ in a 1998 interview with Larry King)” and when discussing gay rights he said ‘I think they ought to be treated equally. Period'” in 2001.
  • Ronald Reagan
    • Federal “employment grew by more than 60,000”.
    • “The national debt soared from $700 billion to $3 trillion”.
    • “After 1981, Reagan raised taxes nearly every year: 1982, 1983, 1984, and 1986.”
    • “In 1986, Reagan passed the Immigration Reform and Control Act, which eventually granted amnesty to 2.7 million illegal immigrants.”
    • “In 1967, he signed a law in California that legalized millions of abortions.”
  • George H.W. Bush
    • “Bush’s final budget increased the marginal tax rate, phased out exemptions for high-income taxpayers”.
    • “Bush also wound up bailing out the savings-and-loan industry with $126 billion in taxpayer money”
    • “He reauthorized the Clean Air Act and even signed the Immigration Act of 1990, a law that increased legal immigration to the U.S. by 40 percent”.
  • George W. Bush
    • By “the end of Bush’s term, the national debt stood at $11.3 trillion-more than double what it was when he took office.”
    • Authorized “an unfunded $7 trillion Medicare drug-benefit program through Congress”.

To read the entire article, click on Even Reagan Wasn’t a Reagan Republican.

Oct 132010
 
Share

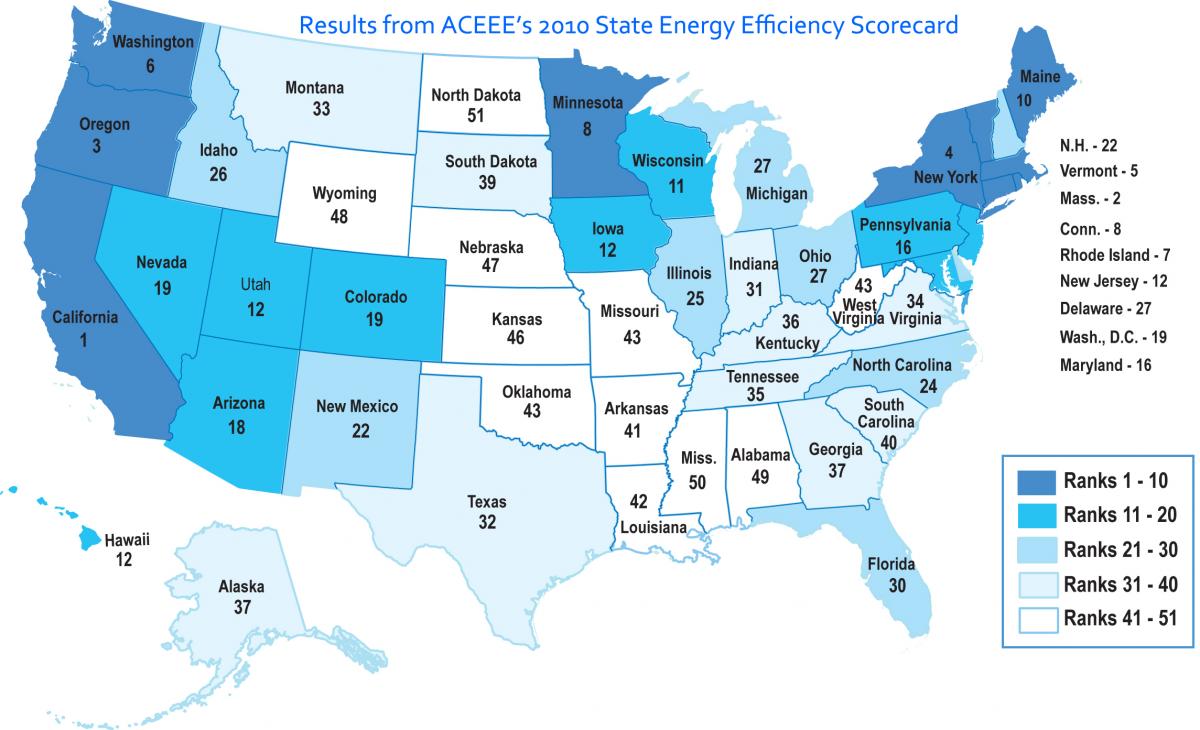
The American Council for an Energy-Efficient Economy in October 2010 released its report ranking the 50 United States in energy efficiency.

  • State energy efficiency budgets almost doubled from 2007
  • “27 states have adopted or have pending Energy Efficiency Resource Standards (EERS) that establish long-term, fixed efficiency savings targets – double the number of states in 2006. These states account for two-thirds of electricity sales in the U.S.”
  • “The injection of more than $11 billion of American Recovery and Reinvestment Act funds directly to state energy efficiency has helped stimulate significant progress in funding and creating new energy-saving programs that are saving consumers money and putting people to work.”

Click on the chart below to see an enlarged, clearer chart.

2010 State Energy Efficiency Scorecard Rankings

To read the entire report, click on 2010 State Energy Efficiency Scorecard.

Oct 132010
 
Share

Mary W. Walsh in The New York Times in October 2010 reported that the municipalities of New York face $200 billion in health care benefits to retirees.

  • The health benefits are separate from the pensions.
  • “Governments have reported their pension obligations for years, but their retiree medical obligations have been building up unseen, because governments were not required to account for them.”
  • “Most credit analysts seem to expect that if a municipality has to default on something, it will default on its retiree health promises, not on its bonds. Pensions, meanwhile, are considered protected by the New York State constitution.”
  • New York City has a retiree health obligation of $62 billion, more than it’s outstanding debt, and roughly equivalent to the state of California.
  • Every resident in Syracuse is responsible for $11,200 of the city’s retired workers’ health care costs; Buffalo’s residents $9,008; New York City’s residents $7,386.

To read the entire article, click on N.Y. Faces $200 Billion in Retiree Health Costs.

Oct 122010
 
Share

Brian Wolly on PBS NewsHour in February 2006 reported previous corruption scandals:

  • Credit Mobilier
    • President Ulysses S. Grant coined the term “lobbying”
    • In the 1860’s and 1870’s, Massachusetts Republican Rep. Oakland Ames sold shares of Credit Mobilier, a railroad firm, to “to his fellow congressmen at prices significantly below market value” in “exchange for support of giving contracts and subsidies to Credit Mobilier”.
    • The “House of Representatives censured Ames and Whig James Brooks of New York. Other implicated politicians included outgoing Vice President Schuyler Colfax, incoming Vice President Henry Wilson, and then-congressman and future President James Garfield.”
  • Teapot Dome
    • In 1923, the Public Lands Committee of the Senate discovered that emergency oil reserves for the Navy had been illegally leased to oil companies by Secretary of the Interior Albert Fall.
    • One of the oil companies’ executives also “implicated several [President Woodrow] Wilson administration officials in his appearance before Congress.
  • Abscam
    • “Six congressmen, Democrats John Jenrette of South Carolina, Raymond Lederer of Pennsylvania, Michael Myers of Pennsylvania, John Murphy of New York and Frank Thompson of New Jersey, and Republican Richard Kelly of Florida, and one senator, Democrat Harrison Williams of New Jersey, were convicted of bribery and conspiracy charges in 1981.”
    • “Democratic Rep. John Murtha of Pennsylvania also was indicted but not prosecuted because he gave evidence against Murphy and Thompson.”
  • Keating Five
    • “The Keating Five scandal from 1989 implicated five senators in another corruption probe. Democrats Dennis DeConcini of Arizona, Donald Riegle of Michigan, John Glenn of Ohio and Alan Cranston of California, and Republican John McCain of Arizona, were accused of strong-arming federal officials to back off their investigation of Charles Keating, former chairman of the Lincoln Savings and Loan association. In exchange, the senators reportedly received close to $1.3 million in campaign contributions.”
    • In August 1991, the Senate Ethics Committee concluded that Glenn and McCain’s three of the senators, DeConcini, Riegle, and Cranston, “acted improperly in interfering with the Federal Home Loan Banking Board’s investigation.”
  • House Banking Scandal
    • “In 1992, many House members were suspected of bouncing checks from accounts they held at the so-called ‘House Bank'”.
    • “Of the 296 sitting representatives and 59 former members who had overdrafted their personal accounts in the preceding 39 months, the House Ethics Committee released a list of the 24 worst abusers. Twenty were Democrats, although Republican Rep. Tommy Robinson of Arkansas was the worse offender, with 996 overdrafts.”

To read the entire article, click on History of Washington Scandals.

Oct 092010
 
Share

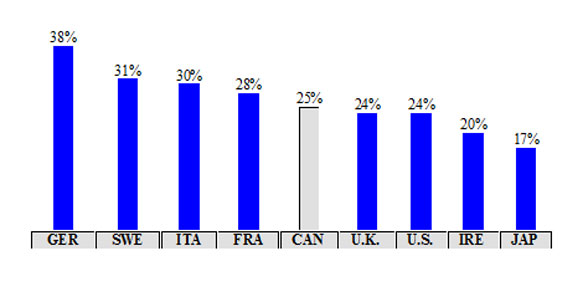
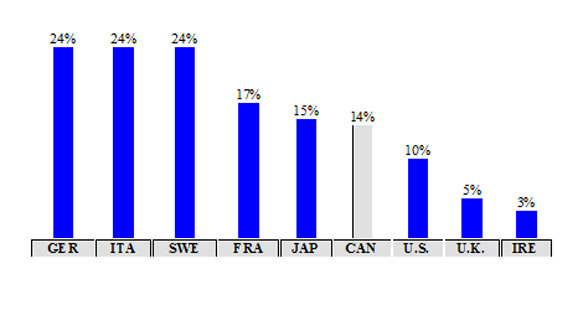
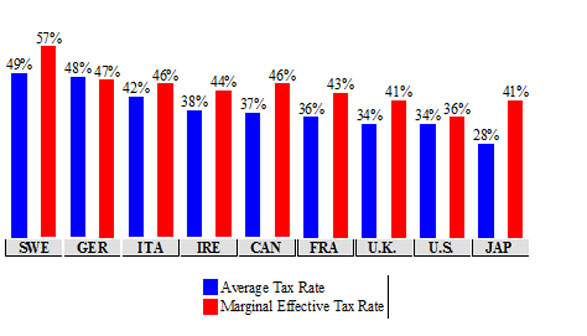
Alexandre Laurin of the Economics Division of the Canadian Parliamentary Information and Research Service in February 2006 reported the following:

Average Tax Rate on Employment Income, Various Countries, 2004
Single Individuals Without Children with Income of $40,000:
Click on the chart below to see an enlarged, clearer chart.

Average Tax Rate on Employment Income, Various Countries, 2004 Single Individuals Without Children with Income of $40,000

Average Tax Rates on Employment Income, Various Countries, 2004
Single Parent with 2 Children and an Income of $40,000:
Click on the chart below to see an enlarged, clearer chart.

Average Tax Rates on Employment Income, Various Countries, 2004 Single Parent with 2 Children and an Income of $40,000

Average Tax Rate and Marginal Effective Tax Rate
on Employment Income, 2004
Single Individual Without Children with Income of $150,000:
Click on the chart below to see an enlarged, clearer chart.

Average Tax Rate and Marginal Effective Tax Rate on Employment Income, 2004 Single Individual Without Children with Income of $150,000

To read the entire report, click on International Tax Burdens: Single Individuals With or Without Children.

Oct 092010
 
Share

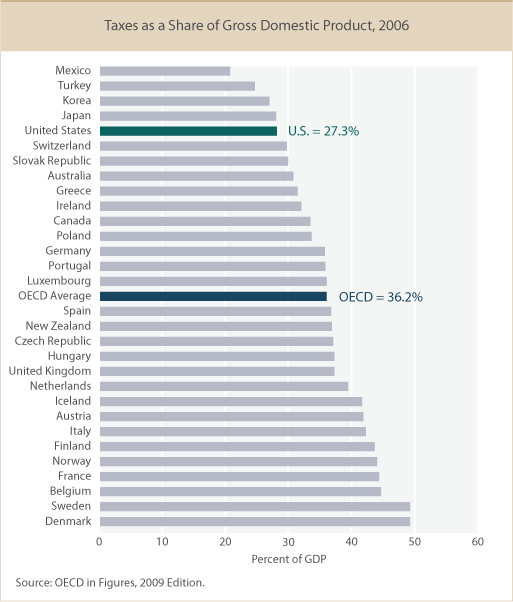
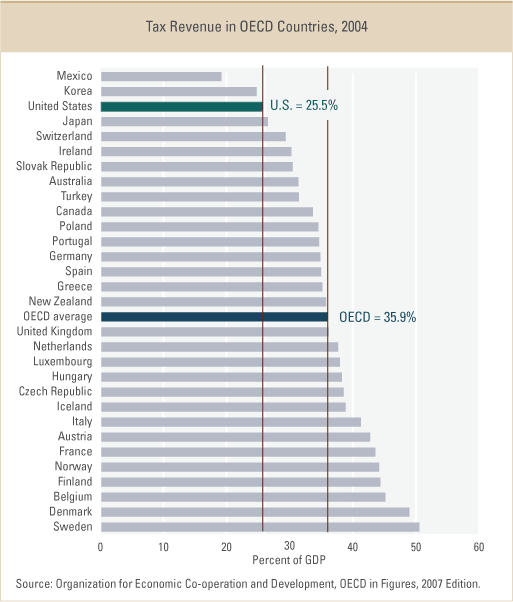
The Tax Policy Center illustrated U.S. taxes at all levels in 2006 and 2004 as a percentage of GDP and compared the U.S. with the remaining 29 member countries of the Organization for Economic Co-operation and Development (OECD). For additional information, click on The Numbers: How do U.S. taxes compare internationally?.

Click on the chart below to see an enlarged, clearer chart.

Tax Rates as a Share of GDP in OECD Countries in 2006

Click on the chart below to see an enlarged, clearer chart.

Tax Rates as a Share of GDP in OECD Countries in 2004