truthfulpolitics.com

Oct 092010
 
Share

The World Bank and PriceWaterhouseCoopers in 2008 reported on business taxes around the world. The 4 most successful tax reforms:

  • Online filing (25% of the world’s countries have online filing for business taxes)
  • Combine taxes, meaning instead of having a labor/payroll tax, property tax, etc., have one tax
  • Simplify tax administration as countries that do not require special accounting books have 10% more revenue as a percentage of GDP
  • Reduce tax rates and broaden the base

The United States ranked 102 out of 178 countries in Corporate Total Tax Rate ranking with a Corporate Total Tax Rate of 46.2%. The lower the ranking the better.

  • Venuatu ranked #1 with a Corporate Total Tax Rate of 8.4%
  • Saudi Arabia ranked #5 with 14.5%
  • United Kingdom ranked #52 with 35.7%
  • Japan ranked #133 with 52.0%
  • France ranked #157 with 66.3%
  • Gambia ranked #178 with 286.7%

To read the entire report, click on Paying Taxes 2008 The global picture.
Oct 092010
 
Share

Politifact researched health care differences between Switzerland, the Netherlands, and the U.S:

  • Who provides the health insurance: private companies in all three countries
  • “the insurers are indeed private, profit-seeking companies”
  • Who has universal coverage: Switzerland and the Netherlands
  • “As for the number of uninsured Americans, the most commonly cited number is 46 million.”
  • Spending: the Netherlands spent 9.8% percent of gross domestic product, it’s economic output, on health care in 2007; Switzerland spent 10.8%; the U.S. spent 16%

To read the entire article, click on Analyst says Netherlands, Switzerland achieve universal coverage through private insurance.

Oct 092010
 
Share

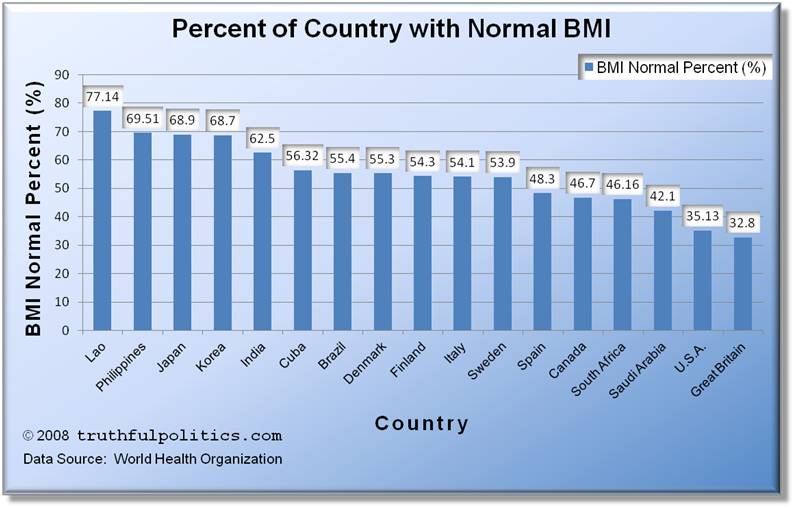
BMI is an index commonly used to classify underweight, normal, overweight, and obese adults. According to the World Health Organization, it is calculated by “weight in kilograms divided by the square of the height in metres (kg/m2). For example, an adult who weighs 70kg and whose height is 1.75m will have a BMI of 22.9.” Normal BMI is within 18.50 – 24.99. A BMI greater than 25 is considered overweight.

The following chart illustrates the percentage of adults in the relative country with a normal BMI. The higher the percentage the better. The World Health Organization has the following warning about the data: “The national BMI data displayed in this graphs are empirical and have been verified that they apply internationally recommended BMI cut-off points. However, it is important to note that the data presented are not directly comparable since they vary in terms of sampling procedures, age ranges and the year(s) of data collection.”

Click on the chart below to see an enlarged, clearer chart.

Percent of Country with Normal BMI

Oct 092010
 
Share

The U.S ranks #46 out of 223 countries, according to the CIA, in longest lifespan. The lower the ranking number the better. Other countries in the rankings:

  • Macau #1 (the longest life expectancy)
  • Japan #3
  • France #9
  • Lebanon #101
  • Vietnam #127
  • Cambodia #176
  • Swaziland #223 (the shortest life expectancy)

To read the entire article, click on Country Comparison :: Life Expectancy at Birth.

Oct 092010
 
Share

The U.S ranks #181 out of 222 countries, according to the CIA, in lowest infant mortality. The higher the ranking number the better. Other countries in the rankings:

  • Singapore #222 (the lowest infant mortality)
  • France #216
  • United Kingdom #193
  • Canada #190
  • Saudi Arabia #144
  • South Africa #59
  • Angola #1 (the highest infant mortality)

To read the entire article, click on Country Comparison :: Infant Mortality Rate.

Oct 092010
 
Share

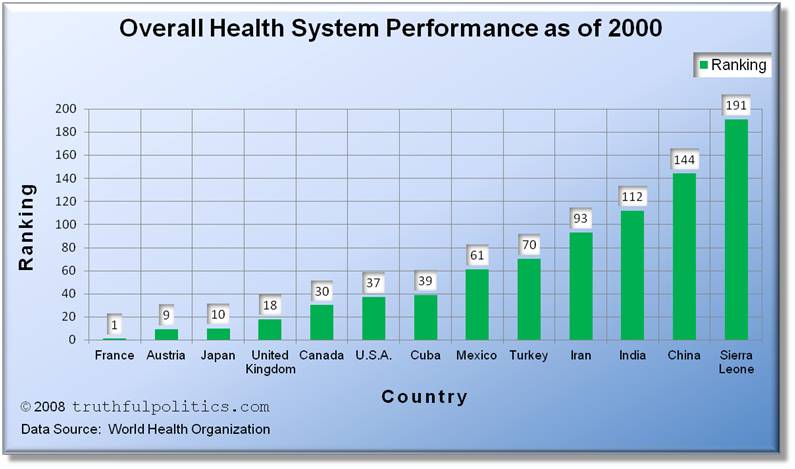
The World Health Organization said the following:

“The U.S. health system spends a higher portion of its gross domestic product than any other country but ranks 37 out of 191 countries according to its performance, the report finds. The United Kingdom, which spends just six percent of GDP on health services, ranks 18 th . Several small countries San Marino, Andorra, Malta and Singapore are rated close behind second- placed Italy.”

Click on the chart below to see an enlarged, clearer chart.

Overall Health System Performance and Ranking by Country

To read the entire press release from 2000, click on World Health Organization Assesses the World’s Health Systems.

Oct 092010
 
Share

Stephen Moore in National Review in February 2004 mentioned a couple of statistics on the size and growth of government. Though the article is from 2004, the statistics and information still provide a current picture of the federal government:

  • “In 1940 there were 4 million Americans working for government and 11 million working in manufacturing. Today, there are 7 million more Americans working for government (21.5 million) than in all manufacturing industries (14.5 million).”
  • “In 1935 there were 4,000 pages of federal regulations in the Federal Register. Now there are 68,000 pages. That’s a 17-fold increase in sixty-five years. Since 1970 the number of federal regulators nearly doubled from 69,000 to 130,000.”
  • George W. Bush’s budget grew, after taking inflation into account, 8% every year for the first 3 years of his presidency.
  • In the budget for 2005, President Bush asked money “to keep marriages intact, to prevent overeating, to encourage teenagers not to have sex, and to help give Americans the willpower to stop smoking.”

To read the entire article, click on Uncle Sam, Inc.

Oct 092010
 
Share
Table 1. Federal Government executive branch civilian employment, except U.S. Postal Service, January 2007
(Employment in thousands)
United States Washington, DC area

Total

1,774 284

Executive departments

1,593 234

Defense, total

623 65

Army

223 19

Navy

168 24

Air Force

152 6

Other

80 16

Veterans Affairs

239 7

Homeland Security

149 20

Treasury

109 14

Justice

105 23

Agriculture

92 11

Interior

66 7

Health and Human Services

60 28

Transportation

53 9

Commerce

39 21

Labor

16 6

Energy

15 5

State

14 12

Housing and Urban Development

10 3

Education

4 3

Independent agencies

179 48

Social Security Administration

62 2

National Aeronautics and Space Administration

18 4

Environmental Protection Agency

18 5

Tennessee Valley Authority

12 0

General Services Administration

12 4

Small Business Administration

6 1

Office of Personnel Management

5 2

Other

45 30

SOURCE: U.S. Office of Personnel Management

To read additional information, click on Federal Government, Excluding the Postal Service.