According to Robert J. Cihak, MD, and Merrill Matthews, Jr., PhD mentioned the following:
- “A recent flu epidemic in Toronto expanded the waiting times to see a family physician to five to six weeks.”
- “In Canada, 121 patients waiting for heart bypass surgery were removed from the waiting list because their condition had worsened to the point that they could no longer survive the surgery.”
To read the entire article, click on Health Care Quality: Would It Survive a Single-Payer System?.
Pat Boone of Newsmax.com in December of 2007 mentioned “the Canadian Supreme Court…ruled in June 2005 that their health system was so bad it actually violates Canadians’ basic human rights! And 12 percent of Canadian physicians and 4 percent of nurses believe they’ve had patients die due to healthcare waiting lines!”
To read the entire article, click on Universal Healthcare Is Unhealthy.
Forest Opine mentioned “Vancouver’s Richmond hospital had 40% of patients waiting for three months or more even at its most efficient, for elective surgery.”
To read the entire article, click on Just Say No to Universal Health Care, Yes to HSAs.
The American College of Physicians mentioned a report from The Commonwealth Fund. “The report noted that insured patients in the United States have rapid access to specialized care. Overall, Germany ranked first on access.”
To read the entire article, click on Achieving a High-Performance Health Care System with Universal Access: What the United States Can Learn from Other Countries.
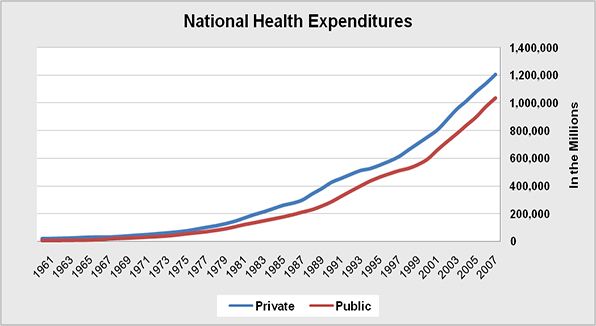
Click on the chart below to see an enlarged, clearer chart.
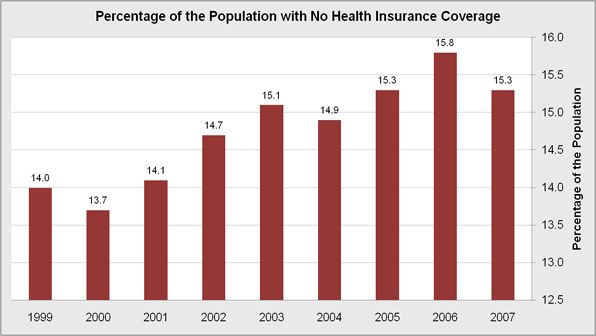
Click on the chart below to see an enlarged, clearer chart.
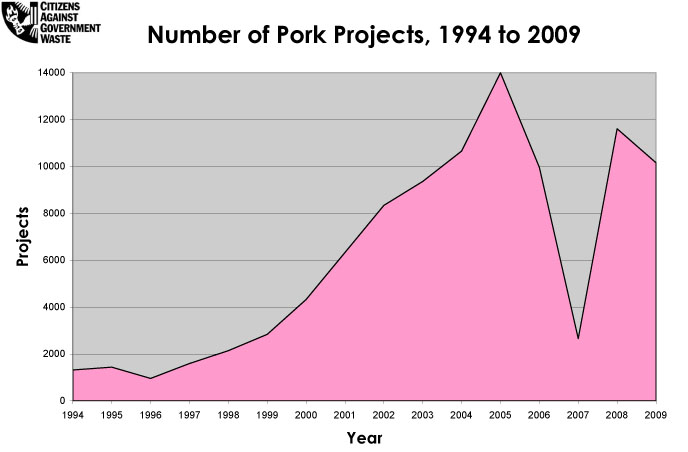
Click on the chart below to see an enlarged, clearer chart.
Click on the chart below to see an enlarged, clearer chart.
In the July/August 2007 issue of Health Affairs, a comparison of waiting times was performed in countries with universal health care:
- Australia: median national waiting time for all patients admitted for surgery from waiting lists was 29 days in 2004-05, up from 27 days in 2000-01
- Canada: median self-reported waiting times were about four weeks for a specialist visit, three weeks for a selected non-emergency diagnostic test, and four weeks for nonemergency surgery
- England: number waiting more than 6 months for inpatient treatment fell from about 265,000 in March 2000 to about 12,000 in November 2005 and number waiting more than 13 weeks for outpatient treatment fell from about 390,000 in March 2000 to about 40,000 in September 2005
- New Zealand: number waiting over 6 months for a specialist assessment fell from about 45,000 in 2000 to about 24,000 in 2005 and number waiting over 6 months for treatment fell from about 30,000 in 2000 to about 6,000 in 2005
- Wales: number of outpatients waiting over 6 months fell from 83,878 patients in October 2002 to 68,845 patients in March 2004 and number of outpatients waiting over 18 months fell from 16,641 in October 2002 to 6,204 in March 2004 and number of inpatients waiting over 18 months fell from 5,964 in September 2003 to 1,401 in March 2004
To view additional charts and details, click on The Commonwealth Fund.
Full citation for the Health Affairs article:
Sharon Willcox, Mary Seddon, Stephen Dunn, Rhiannon Tudor Edwards, Jim Pearse, and Jack V. Tu
Measuring And Reducing Waiting Times: A Cross-National Comparison Of Strategies
Health Affairs, July/August 2007; 26(4): 1078-1087.
To read the entire article, click on Measuring And Reducing Waiting Times: A Cross-National Comparison Of Strategies.