This article contains information and statistics from various sources on guns, gun control, and gun violence.
James Agresti and Reid Smith in Just Facts reported the following:
| Households With a Gun | Adults Owning a Gun | Adults Owning a Handgun | |
| Percentage | 40-45% | 30-34% | 17-19% |
| Number | 47-53 million | 70-80 million | 40-45 million |
Roughly 16,272 murders were committed in the United States during 2008. Of these, about 10,886 or 67% were committed with firearms.
During the years in which the D.C. handgun ban and trigger lock law was in effect, the Washington, D.C. murder rate averaged 73% higher than it was at the outset of the law, while the U.S. murder rate averaged 11% lower.
During 2002 and 2003, out of 17 million background checks resulting in 120,000 denials, the federal government prosecuted 154 people (about one-tenth of 1% of the denials).
In the three-year period from October 2003 through September 2006, the Bureau of Alcohol, Tobacco and Firearms (ATF) conducted 202 operations at 195 gun shows, leading to 121 arrests and 83 convictions (with some cases still pending as of June 2007).
A 1997 U.S. Justice Department survey of 14,285 state prison inmates found that among those inmates who carried a firearm during the offense for which they were sent to jail, 0.7% obtained the firearm at a gun show, 1% at a flea market, 3.8% from a pawn shop, 8.3% from a retail store, 39.2% through an illegal/street source, and 39.6% through family or friends.
| Total Contributions | Donations to Democrats | Donations to Republicans | Percent to Democrats | Percent to Republicans | |
| Gun Rights | $22,467,579 | $3,231,405 | $19,195,400 | 14% | 85% |
| Gun Control | $1,888,886 | $1,776,310 | $112,326 | 94% | 6% |
To read the entire article and see additional charts and statistics, click on Gun Control Facts.
Full citation: “Gun Control Facts.” By James D. Agresti and Reid K. Smith. Just Facts, September 13, 2010. Revised 2/11/13.
Don Kates and Gary Mauser wrote about the correlation between the amount of guns and the amount of deaths across different countries.
| European Gun Ownership and Murder Rates | ||
| (rates given are per 100,000 people and in descending order) | ||
| Nation | Murder Rate | Rate of Gun Ownership |
| Russia | 20.54 [2002] | 4,000 |
| Luxembourg | 9.01 [2002] | c. 0 |
| Hungary | 2.22 [2003] | 2,000 |
| Finland | 1.98 [2004] | 39,000 |
| Sweden | 1.87 [2001] | 24,000 |
| Poland | 1.79 [2003] | 1,500 |
| France | 1.65 [2003] | 30,000 |
| Denmark | 1.21 [2003] | 19,000 |
| Greece | 1.12 [2003] | 11,000 |
| Switzerland | 0.99 [2003] | 16,000 |
| Germany | 0.93 [2003] | 30,000 |
| Norway | 0.81 [2001] | 36,000 |
| Austria | 0.80 [2002] | 17,000 |
| Eastern Europe Gun Ownership and Murder Rates | |||
| (rates given are per 100,000 people and in descending order) | |||
| Nation | Murder Rate | Year | Rate of Gun Ownership |
| Russia | 20.54 | [2002] | 4,000 |
| Moldova | 8.13 | [2000] | 1,000 |
| Slovakia | 2.65 | [2000] | 3,000 |
| Romania | 2.5 | [2000] | 300 |
| Macedonia | 2.31 | [2000] | 16,000 |
| Hungary | 2.22 | [2003] | 2,000 |
| Finland | 1.98 | [2004] | 39,000 |
| Poland | 1.79 | [2003] | 1,500 |
| Slovenia | 1.81 | [2000] | 5,000 |
| Cz. Republic | 1.69 | [2000] | 5,000 |
| Greece | 1.12 | [2003] | 11,000 |
| Intentional Deaths: United States vs. Continental Europe Rates | |||
| In order of highest combined rate; nations having higher rates than the United States are indicated by asterisk (suicide rate) or + sign (murder rate). | |||
| Nation | Suicide | Murder | Combined rates |
| Russia | 41.2* | 30.6+ | 71.8 |
| Estonia | 40.1* | 22.2+ | 62.3 |
| Latvia | 40.7* | 18.2+ | 58.9 |
| Lithuania | 45.6* | 11.7+ | 57.3 |
| Belarus | 27.9* | 10.4+ | 38.3 |
| Hungary | 32.9* | 3.5 | 36.4 |
| Ukraine | 22.5* | 11.3+ | 33.8 |
| Slovenia | 28.4* | 2.4 | 30.4 |
| Finland | 27.2* | 2.9 | 30.1 |
| Denmark | 22.3* | 4.9 | 27.2 |
| Croatia | 22.8* | 3.3 | 26.1 |
| Austria | 22.2* | 1.0 | 23.2 |
| Bulgaria | 17.3* | 5.1 | 22.4 |
| France | 20.8* | 1.1 | 21.9 |
| Switzerland | 21.4* | 1.1 | 24.1 |
| Belgium | 18.7* | 1.7 | 20.4 |
| United States | 11.6 | 7.8 | 19.4 |
| Poland | 14.2* | 2.8 | 17.0 |
| Germany | 15.8* | 1.1 | 16.9 |
| Romania | 12.3* | 4.1 | 16.4 |
| Sweden | 15.3* | 1.0 | 16.3 |
| Norway | 12.3* | 0.8 | 13.1 |
| Holland | 9.8 | 1.2 | 11.0 |
| Italy | 8.2 | 1.7 | 9.9 |
| Portugal | 8.2 | 1.7 | 9.9 |
| Spain | 8.1 | 0.9 | 9.0 |
| Greece | 3.3 | 1.3 | 4.6 |
To read the entire report, click on Would Banning Firearms Reduce Murder and Suicide?
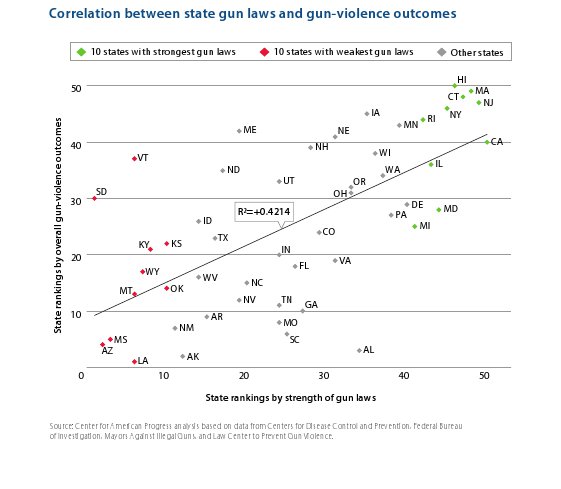
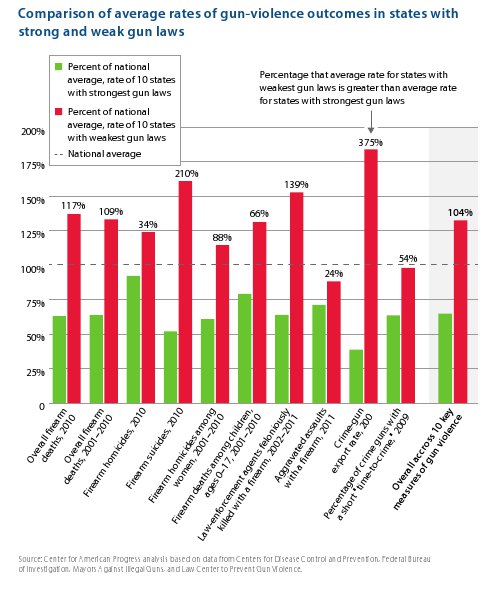
Arkadi Gerney, Chelsea Parsons, and Charles Posner in April 2013 from the Center for American Progress wrote about the 50 U.S. states and the correlation between gun violence and gun laws.
Click on the chart below to see an enlarged, clearer chart.


To read the entire report, click on America Under the Gun.
Sorry, the comment form is closed at this time.