truthful politics reviewed U.S. debt statistics provided by the U.S. Office of Management and Budget. The Office of Management and Budget provides the official numbers on debt for the U.S. Below are several charts and pieces of information on U.S. federal debt.
- From 1940 to the end of year 2015 (the latest figures available as of the writing of this article), the average increase in the federal debt was 9.3% under a Democratic President and 7.9% under a Republican President when including World War II.
- When excluding World War II (therefore, 1946 to end of year 2015), the average increase in the federal debt was 4.7% under a Democratic President and 7.9% under a Republican President. The Republican President percentage remains the same when excluding World War II, because the United States had Democratic Presidents during World War II.
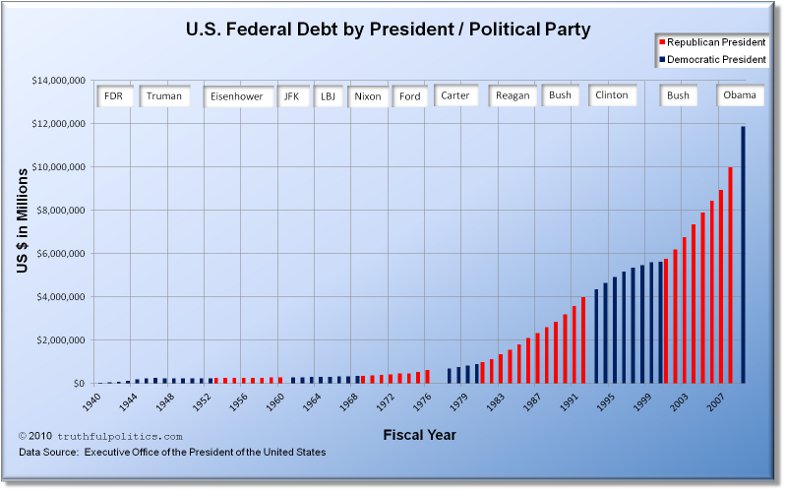
- The first chart below shows the amount of U.S. federal debt in U.S. dollars.
- Blank years of 1937, 1938, and 1939 have been added to make the year markers match presidential terms.
- The transition quarter, or TQ, in 1976 has been removed.
Click on the chart below to see an enlarged, clearer chart.

The second chart below shows the amount of U.S. federal debt as a percentage of GDP.
- GDP stands for Gross Domestic Product and measures the size of the economy. Therefore, the chart shows the debt as a percentage of the U.S. economy.
- I.e., in 1940, the federal debt equaled $50.696 billion and the economy was $98.2 billion. Therefore, the federal debt as a percentage of GDP equaled 51.6%.
- Blank years of 1937, 1938, and 1939 have been added to make the year markers match presidential terms.
- The transition quarter, or TQ, in 1976 has been removed.
Click on the chart below to see an enlarged, clearer chart.

The table below shows the increase in U.S. federal debt during the tenure of the respective President:
| Increase in Billions US $ | President | Political Party |
| $153 | Franklin D. Roosevelt | Democratic |
| $55 | Harry S. Truman | Democratic |
| $31 | Dwight D. Eisenhower | Republican |
| $20 | John F. Kennedy | Democratic |
| $58 | Lyndon B. Johnson | Democratic |
| $115 | Richard Nixon | Republican |
| $145 | Gerald Ford | Republican |
| $280 | Jimmy Carter | Democratic |
| $1,692 | Ronald Reagan | Republican |
| $1,401 | George H.W. Bush | Republican |
| $1,627 | Bill Clinton | Democratic |
| $4,357 | George W. Bush | Republican |
| $8,134 | Barack H. Obama | Democratic |
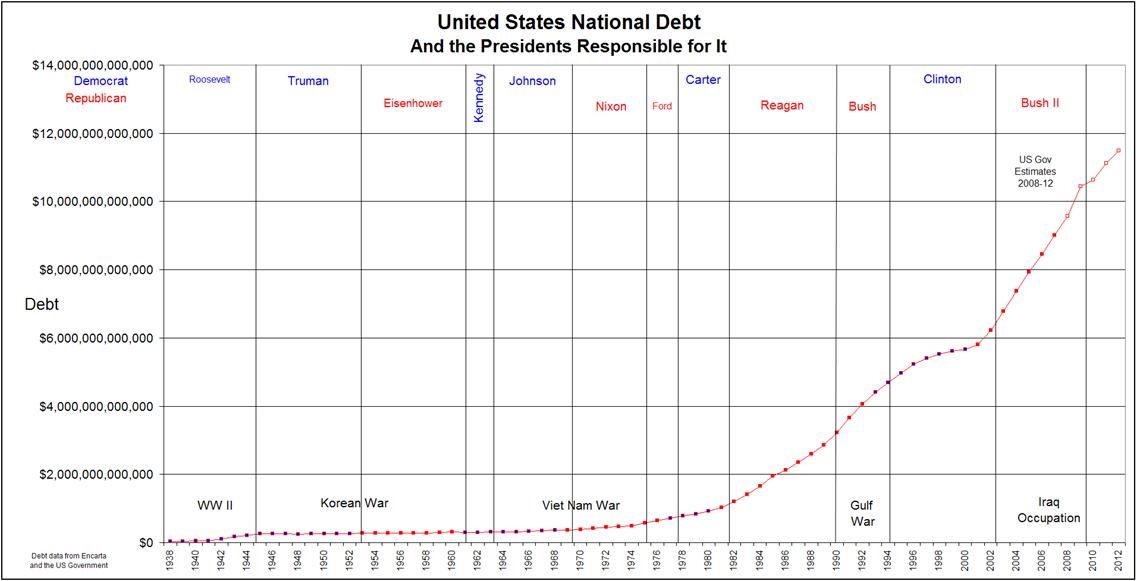
The third chart below is an older chart that shows U.S. federal debt up to 2010.
Click on the chart below to see an enlarged, clearer chart.
To review the source data, click on Budget of the United States Government.
Steve McGourty created the following United States National Debt graph by president:
Click on the chart below to see an enlarged, clearer chart.
To read the entire article, click on United States National Debt. To read additional truthful politics article on the federal debt, click on The Federal Debt or U.S. Federal Debt Change (Increase/Decrease) by President.
Sorry, the comment form is closed at this time.