truthful politics reviewed U.S. government employment statistics provided by the United States Bureau of Labor Statistics. The Bureau of Labor Statistics provides the official numbers on jobs for the U.S.
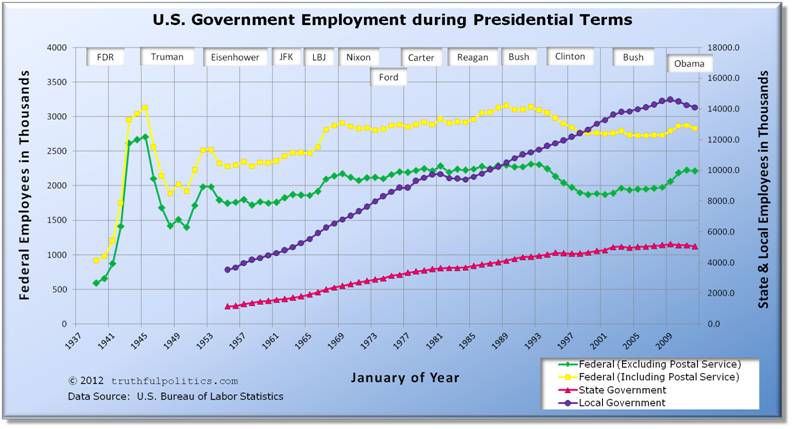
- The chart shows the number of employees in thousands.
- Federal employment is indicated on the left vertical axis (i.e., in January of 2012, federal employees, including the Postal Service, equaled 2.8 million).
- State and local employment is indicated on the right vertical axis (i.e., in January of 2012, local employees equaled 14.1 million).
- Blank years of 1937 and 1938 have been added to make the year markers match presidential terms.
- To see the raw data on the Bureau’s website, use Series IDs CES9091100001, CES9091000001, CES9092000001, and CES9093000001.
Click on the chart below to see an enlarged, clearer chart.
To read additional information, click on United States Bureau of Labor Statistics.
PLA cited the following statistics:
- “Under the 20 years of Republican administrations the number of non-defense government employees rose by 310,000.
- Under the 20 years of Democratic administrations, the number of non-defense government employees rose by 59,000.
- Of the 369,000 employees added between 1962 and 2001, 84% were added under Republican administrations and 16% were added under Democratic administrations.”
To read the entire article, click on Just for the Record Part II.
truthful politics reviewed the official Executive Branch and Uniformed Military employment numbers provided by the U.S. Government Printing Office.
| Executive Branch Increase/Decrease Over Term (thousands) | Uniformed Military Personnel Increase/Decrease Over Term (thousands) | President | Political Party |
| 13 | -108 | John F. Kennedy | Democratic |
| 550 | 865 | Lyndon B. Johnson | Democratic |
| -193 | -1301 | Richard Nixon | Republican |
| -15 | -45 | Gerald Ford | Republican |
| -19 | -22 | Jimmy Carter | Democratic |
| 248 | 54 | Ronald Reagan | Republican |
| -47 | -320 | George H. W. Bush | Republican |
| -308 | -318 | Bill Clinton | Democratic |
| -4 | -1 | George W. Bush | Republican |
For further information, click on Budget of the United States Government: Main Page.
Brian Doherty in Reason in February 2003 reported that over the past 40 years, Democratic administrations have added 31,000 civilian defense jobs and 49,000 non-defense jobs. Republican administrations over the same time have reduced civilian defense jobs by 426,000 and added 320,000 non-defense jobs.
Government Employees Added or (Subtracted)

                  Civilian Defense  Non-Defense

Kennedy               (12,000)           73,000
Johnson                312,000          105,000
Nixon/Ford           (333,000)          213,000
Carter                (25,000)         (14,000)
Reagan                  91,000            3,000
George H.W. Bush     (184,000)          104,000
Clinton              (244,000)        (115,000)

Source: Budget for Fiscal Year 2003 Historical Table 17.1,
"Total Executive Branch Civilian Employees: 1940-2001"
To read the entire article, click on All the presidents’ employees – Data – federal employment growth or shrinkage by president – Brief Article.
Sorry, the comment form is closed at this time.