Mar 062016
The Office of Management and Budget annually provides a report on spending. The two charts below display the most up to date data as of the time of publishing. To view the source data, please refer to Table 1.3 of the budget.
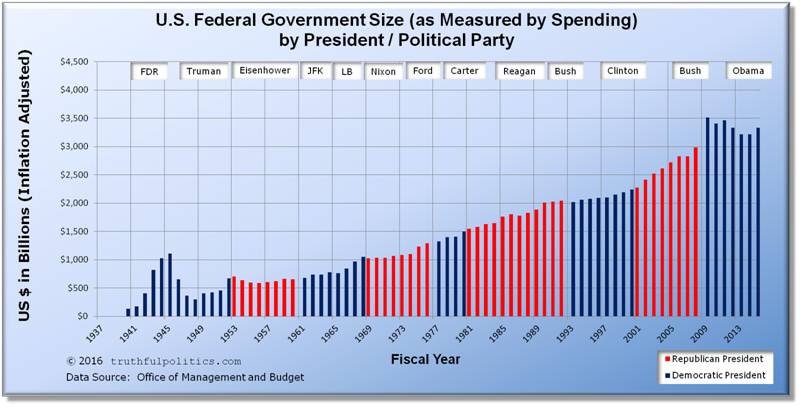
- The first chart is inflation adjusted, displaying all dollar amounts in constant fiscal year 2009 dollars, as provided by the Office of Management and Budget.
- Therefore, dollar amounts prior to year 2009 are inflated and dollar amounts after 2009 are deflated. For example, U.S. federal government expenditures in 1940 were $9.5 billion dollars; that spending level is the equivalent of $135.8 billion in 2009 dollars. Likewise, U.S. federal government expenditures in 2015 were $3,688.3 billion dollars; that spending level is the equivalent of $3,336.0 billion in 2009 dollars.
- Blank years of 1937, 1938, and 1939 have been added to make the year markers match presidential terms.
- The transition quarter, or TQ, in 1976 has been removed.
- Since 1940, the average percentage increase in government spending during Democratic presidents is 9.6% and the average percentage increase during Republican presidents is 2.2%. These aforementioned percentages include World War II.
- When excluding World War II (therefore, since 1946), the average increase in government spending was 2.4% under a Democratic President and 2.2% under a Republican President. The Republican President percentage remains the same when excluding World War II because the United States had Democratic Presidents during World War II.
Click on the chart below to see an enlarged, clearer chart.
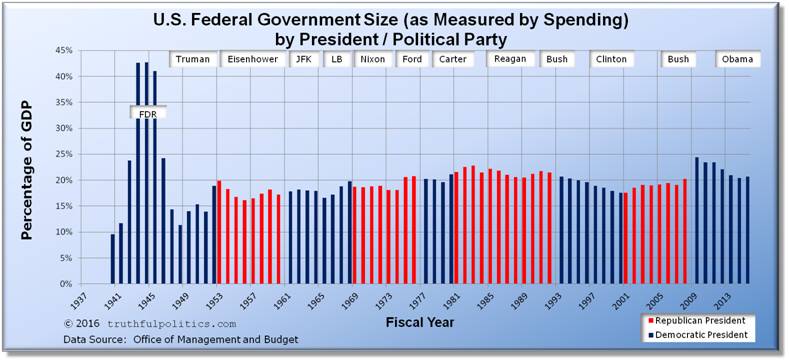
The second chart below shows the amount of U.S. federal government spending as a percentage of GDP.
- GDP stands for Gross Domestic Product and measures the size of the economy. Therefore, the chart shows spending as a percentage of the U.S. economy.
- I.e., in 1940, federal spending equaled $9.5 billion and the economy was $98.2 billion. Therefore, federal spending as a percentage of GDP equaled 9.67% (the official historical tables say 9.6%).
- I.e., in 2009, federal spending equaled $3,517.7 billion and the economy was $14,414.6 billion. Therefore, federal spending as a percentage of GDP equaled 24.4%.
- Blank years of 1937, 1938, and 1939 have been added to make the year markers match presidential terms.
- The transition quarter, or TQ, in 1976 has been removed.
- When including World War II, the average spending as a percentage of GDP under a Democratic President was 20.7% and under a Republican President 19.6%.
- When excluding World War II, the average spending as a percentage of GDP under a Democratic President was 19.0% and under a Republican President 19.6%. The Republican President percentage remains the same because the United States had Democratic Presidents during World War II.
Click on the chart below to see an enlarged, clearer chart.
To read additional information, including the source data, click on Budget of the United States Government. For information on how the U.S. government spends money, click on How the Federal Government Spends Money.
Sorry, the comment form is closed at this time.