truthful politics reviewed data from various sources on Social Security. The official report that shows the current and projected financial status of Social Security is the Annual Report of the Board of Trustees of the Federal Old-Age and Survivors Insurance and Federal Disability Insurance Trust Funds.
Mark Weisbrot in the Center for Economic and Policy Research in December 2010 reported the following:
- 60% of Americans under the age 0f 60 believe Social Security will not be there when they retire
- 70% of Americans under the age of 50 believe Social Security will not pay them benefits when they retire
- The official Social Security Trustees Report says that Social Security can pay all benefits for the next 27 years.
- The official report also says that if no changes are made to Social Security in the next 27 years, then, starting in 2037, 75% of the scheduled benefits will be paid. 75% of scheduled benefits “would still be more than what retirees receive today, after adjusting for inflation.”
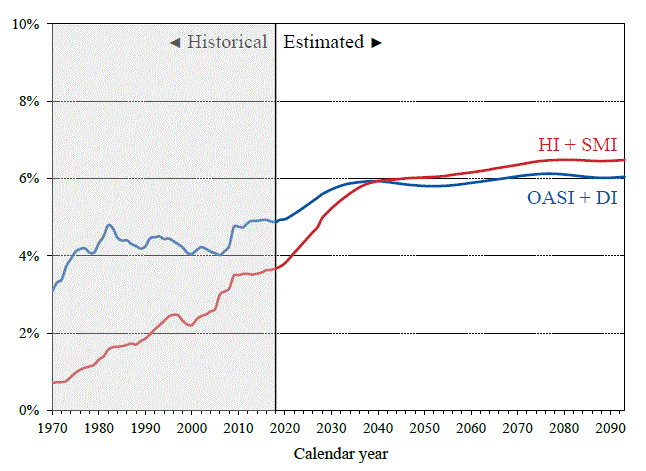
- When discussions talk about public spending exploding in an unsustainable fashion, Social Security and Medicare are combined, however, it is Medicare whose spending explodes, not Social Security.
- The increase spending for Medicare is caused by private sector health care costs rising. “If these [private sector health care costs] were in line with any other high-income country such as Germany or Canada, our long-term budget deficit would turn into a surplus.”
According to the Social Security Trustees Report in 2010:
- The Hospital Insurance (HI) Trust Fund, part of Medicare, is projected to last 12 years longer because of the health care reform laws passed in 2010.
- The Medicare Supplementary Medical Insurance (SMI) program projected costs as a share of GDP over the next 75 years are down 23% from the projected costs in the 2009 report. This decrease is also due to the health care reform laws.
The following charts are from the Social Security Trustees Report. The charts have updated statistics based on the health care reform laws passed in 2010, respectively called the Patient Protection and Affordable Care Act of 2010 as amended by the Health Care and Education Reconciliation Act of 2010 (the “Affordable Care Act” or ACA).
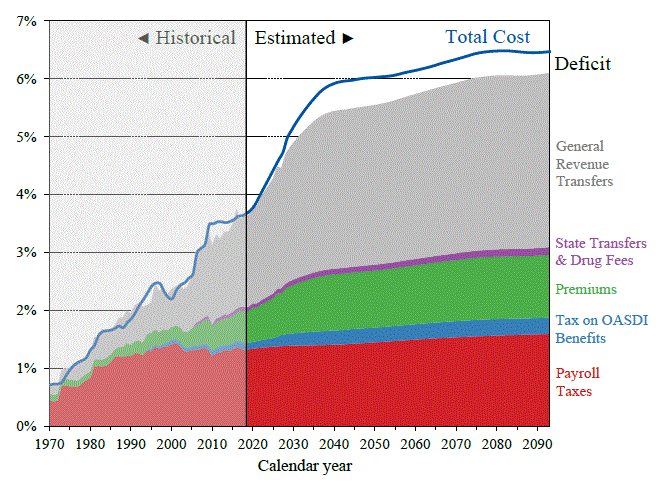
OASI, DI, and HI Trust Fund Ratios
(Assets as a percentage of annual expenditures)
Click on the chart below to see an enlarged, clearer chart.

Social Security and Medicare Cost as a Percentage of GDP
Click on the chart below to see an enlarged, clearer chart.

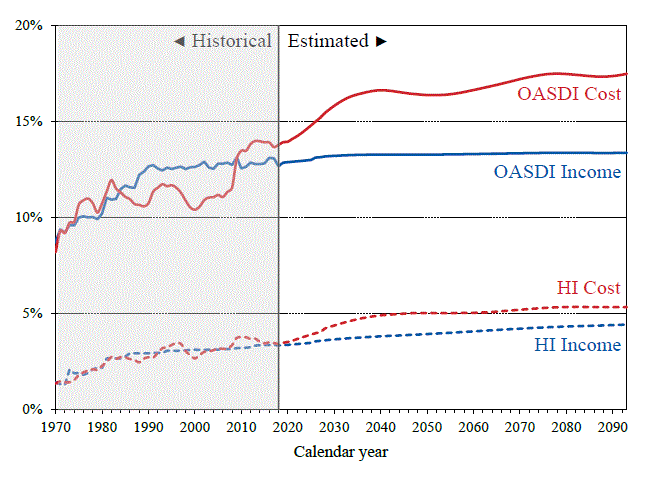
Income and Cost Rates
(Percentage of taxable payroll)
Click on the chart below to see an enlarged, clearer chart.

To read the entire CEPR article, click on Don’t Touch Social Security: Drive for Cuts Based on Deception. To read the Social Security Trustees Reports from the most current year and previous years, click on Reports from the Board of Trustees. To read additional information on the charts, click on Status of the Social Security and Medicare Programs.
Sorry, the comment form is closed at this time.