Nov 192010
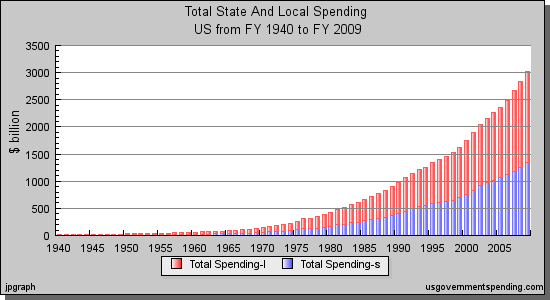
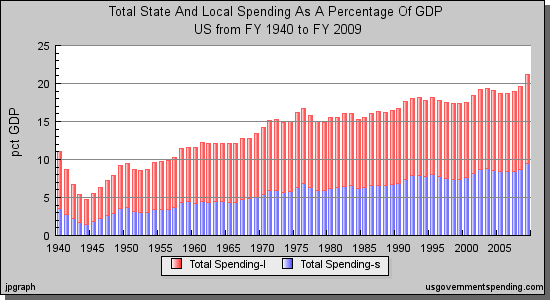
The following charts show U.S. state and local government spending. “Total Spending-l” is local spending and “Total Spending-s” is state spending.
Click on the chart below to see an enlarged, clearer chart.
Click on the chart below to see an enlarged, clearer chart.
For additional data, click on usgovernmentspending.com.
Thomas A. Garrett and John C. Leatherman of Kansas State University in 2000 mentioned the following:
- 1960: state governments spent $740 per person, local governments spent $670 per person
- 1996: state governments spent $2,600 per person, local governments spent $1,600 per person
- Between 1960 and 1996, state expenditures and revenues as a percent of GDP doubled
- Between 1960 and 1996, local expenditures and revenues as a percent of GDP increased by 50%
To read the entire report, click on An Introduction to State and Local Public Finance.
Sorry, the comment form is closed at this time.