truthfulpolitics.com

Apr 082013
 
Share

Below is information from many different sources on how the U.S. federal government spends money. Several bar and pie charts are also included. All the charts expand to make the data easier to view. Click on a chart to expand it, and click on the expanded chart to shrink it back to its original size.

The first three charts are from the Office of Management and Budget, which provides the official numbers for the annual budget for the U.S.

  • The first chart shows spending by government agency as of 2011 (the most recent numbers available as of the writing of this article).
  • “Undistributed Offsetting Receipts” are not included.
  • Some of the percentages are 0% due to rounding.
  • To view the source data, please refer to Table 4.1 of the budget.

Click on the chart below to see an enlarged, clearer chart.
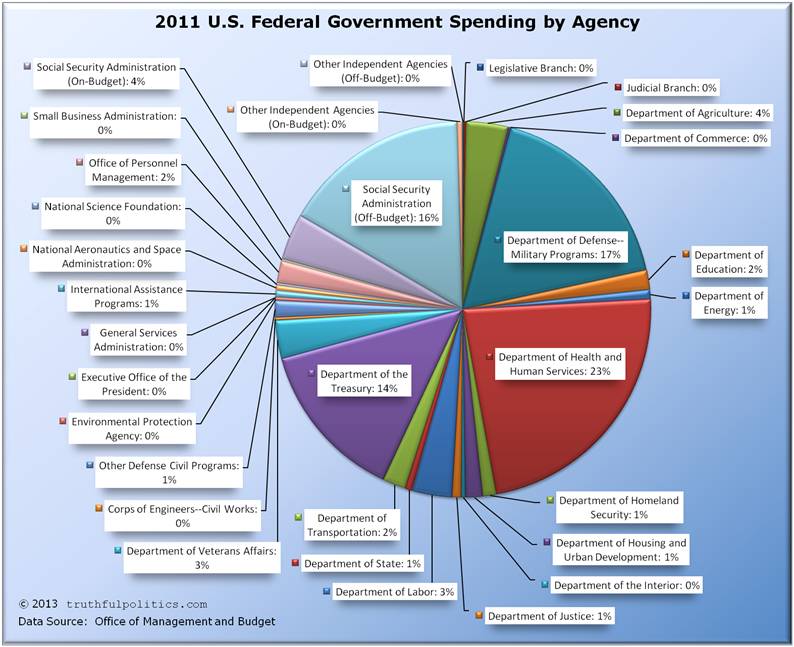
2011 U.S. Federal Government Spending by Agency

  • The second chart shows spending by government agency as of 2010.
  • Some of the percentages are 0% due to rounding.
  • To view the source data, please refer to Table 4.1 of the budget.

Click on the chart below to see an enlarged, clearer chart.
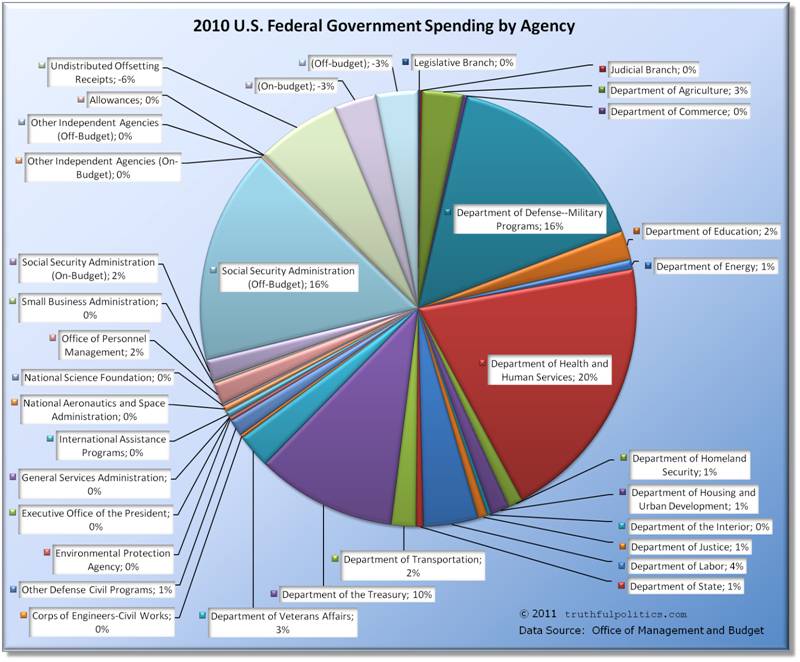
2010 U.S. Federal Government Spending by Agency

  • The third chart shows spending by government program as of 2010 (the most recent numbers available as of the writing of this article).
  • Some of the percentages are 0% due to rounding.
  • To view the source data, please refer to Table 27-14 of the budget.

Click on the chart below to see an enlarged, clearer chart.
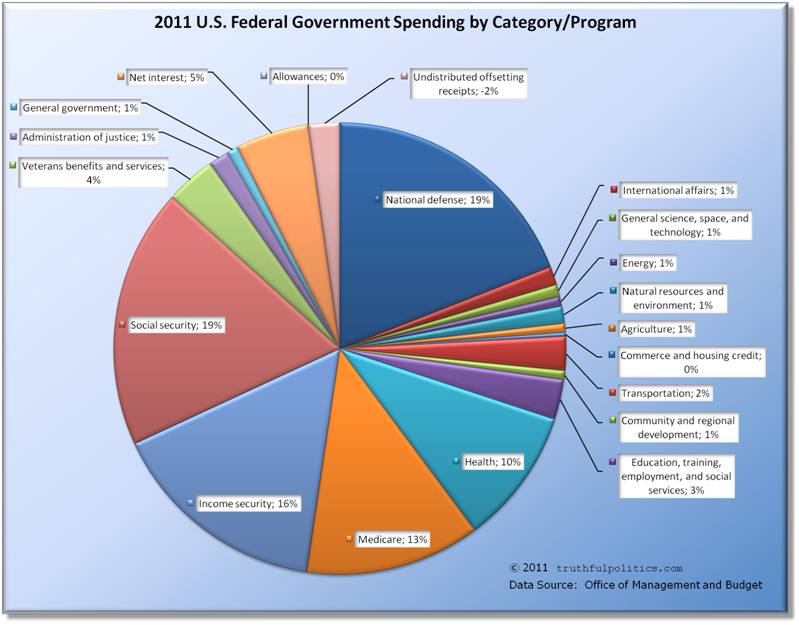
2011 U.S. Federal Government Spending by Category or Program

To read additional information, including the source data, click on Budget of the United States Government.


The website Federal Budget Spending, Deficits, and the National Debt has the following graph:

Click on the chart below to see an enlarged, clearer chart.

How Congress Spends Your Money

Click on Federal Budget Spending, Deficits, and the National Debt to visit the website.


The Heritage Foundation has the following chart:

For more charts, click on Federal Budget in Pictures.


The Perot Charts website illustrates trends in federal government spending:

Click on the chart below to see an enlarged, clearer chart.
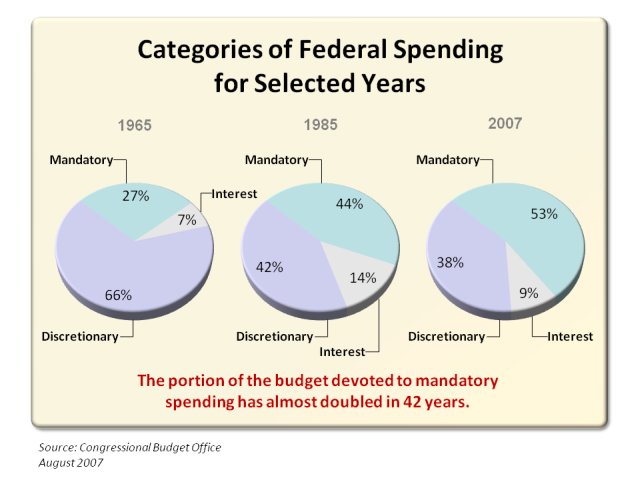
How the Federal Government Spends Money Pie Chart

Additional information and charts are no longer available as Perot Charts is now discontinued.


Project America illustrated overall U.S. federal government spending by department. The Department of Defense is not shown:

Click on the chart below to see an enlarged, clearer chart.
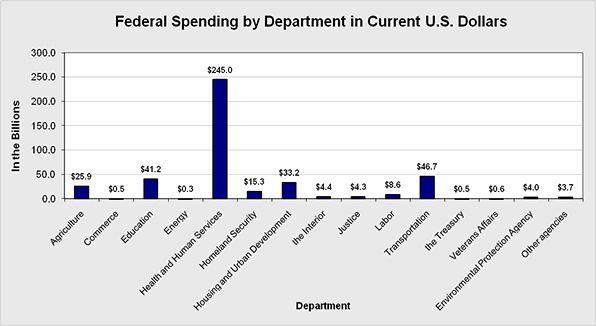
U.S. Federal Spending by Department

For additional information, click on Project America: Budget: Spending: Spending By Department.


Project America illustrated the overall U.S. federal government spending by program:

Click on the chart below to see an enlarged, clearer chart.
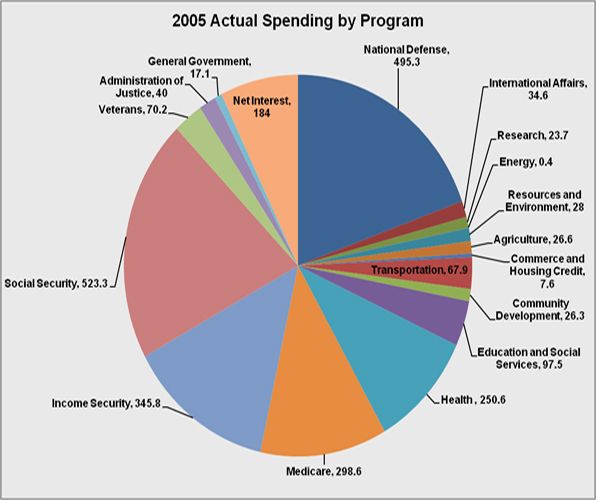
U.S. Federal Spending by Program Pie Chart

For additional information, click on Project America: Budget: Spending: Spending by Program.


MSN Money had an article summarizing how the US spends tax dollars:

  • The biggest single chunk of that so-called nondiscretionary spending — more than 20% of the total budget — is used to pay Social Security benefits to retirees
  • Another 15% pays the tab for Medicare health benefits
  • An additional 7% goes for Medicaid, 3% for veterans’ benefits and 1.3% for supplemental security income used to assist the aged, disabled and blind
  • Aid to poor families with children (welfare, which accounts for about 1% of the budget), food stamps (about 1.3%), farm subsidies (1%)
  • Interest on the debt claims about 10% of the budget

To read the entire article, click on How Uncle Sam spends your tax dollar.

Sep 132012
 
Share

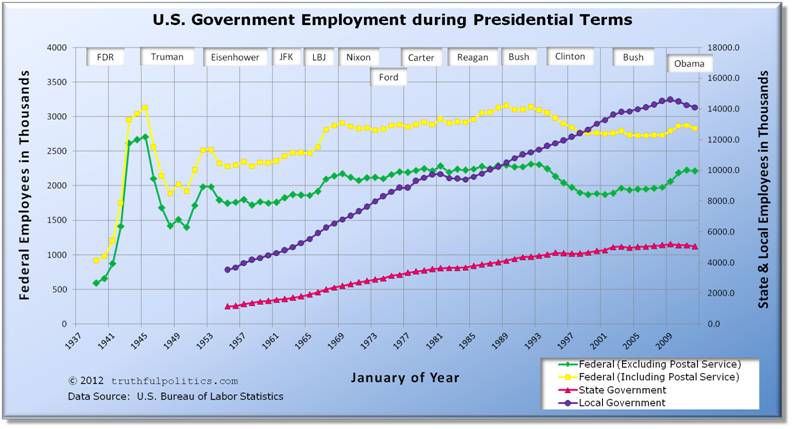
truthful politics reviewed U.S. government employment statistics provided by the United States Bureau of Labor Statistics. The Bureau of Labor Statistics provides the official numbers on jobs for the U.S.

  • The chart shows the number of employees in thousands.
  • Federal employment is indicated on the left vertical axis (i.e., in January of 2012, federal employees, including the Postal Service, equaled 2.8 million).
  • State and local employment is indicated on the right vertical axis (i.e., in January of 2012, local employees equaled 14.1 million).
  • Blank years of 1937 and 1938 have been added to make the year markers match presidential terms.
  • To see the raw data on the Bureau’s website, use Series IDs CES9091100001, CES9091000001, CES9092000001, and CES9093000001.

Click on the chart below to see an enlarged, clearer chart.

U.S. Government Employment during Presidential Terms

To read additional information, click on United States Bureau of Labor Statistics.


PLA cited the following statistics:

  • “Under the 20 years of Republican administrations the number of non-defense government employees rose by 310,000.
  • Under the 20 years of Democratic administrations, the number of non-defense government employees rose by 59,000.
  • Of the 369,000 employees added between 1962 and 2001, 84% were added under Republican administrations and 16% were added under Democratic administrations.”

To read the entire article, click on Just for the Record Part II.


truthful politics reviewed the official Executive Branch and Uniformed Military employment numbers provided by the U.S. Government Printing Office.

Executive Branch Increase/Decrease Over Term (thousands) Uniformed Military Personnel Increase/Decrease Over Term (thousands) President Political Party
13 -108 John F. Kennedy Democratic
550 865 Lyndon B. Johnson Democratic
-193 -1301 Richard Nixon Republican
-15 -45 Gerald Ford Republican
-19 -22 Jimmy Carter Democratic
248 54 Ronald Reagan Republican
-47 -320 George H. W. Bush Republican
-308 -318 Bill Clinton Democratic
-4 -1 George W. Bush Republican

For further information, click on Budget of the United States Government: Main Page.


Brian Doherty in Reason in February 2003 reported that over the past 40 years, Democratic administrations have added 31,000 civilian defense jobs and 49,000 non-defense jobs. Republican administrations over the same time have reduced civilian defense jobs by 426,000 and added 320,000 non-defense jobs.

Government Employees Added or (Subtracted)

                  Civilian Defense  Non-Defense

Kennedy               (12,000)           73,000
Johnson                312,000          105,000
Nixon/Ford           (333,000)          213,000
Carter                (25,000)         (14,000)
Reagan                  91,000            3,000
George H.W. Bush     (184,000)          104,000
Clinton              (244,000)        (115,000)

Source: Budget for Fiscal Year 2003 Historical Table 17.1,
"Total Executive Branch Civilian Employees: 1940-2001"

To read the entire article, click on All the presidents’ employees – Data – federal employment growth or shrinkage by president – Brief Article.


Simpson-Bowles National Commission on Fiscal Responsibility and Reform

 Posted by  Economic Performance, Government Debt, Government Spending, Health Care, Taxes  Comments Off on Simpson-Bowles National Commission on Fiscal Responsibility and Reform
Sep 082012
 
Share

This article contains several charts and videos concerning the National Commission on Fiscal Responsibility and Reform. All the charts expand to make the data easier to view. Click on a chart to expand it, and click on the expanded chart to shrink it back to its original size.

The National Commission on Fiscal Responsibility and Reform was a bipartisan, meaning it involved members from both the Democratic and Republican political parties, commission “charged with identifying policies to improve the fiscal situation in the medium term and to achieve fiscal sustainability over the long run.” The Commission is sometimes referred to as the Bowles-Simpson Commission, Simpson-Bowles Commission, or Fiscal Commission.

The Commission had three groups:

  • Discretionary Working Group to “research and discuss issues related to discretionary spending.”
  • Mandatory Working Group to “research and discuss issues related to mandatory spending.”
  • Tax Reform Working Group to “research and discuss issues related to tax reform.”

Following are some of the charts and information from the report. Click on the chart to expand it for easier viewing, click again on the expanded chart to shrink it back to its original size.

Click on the chart below to see an enlarged, clearer chart.

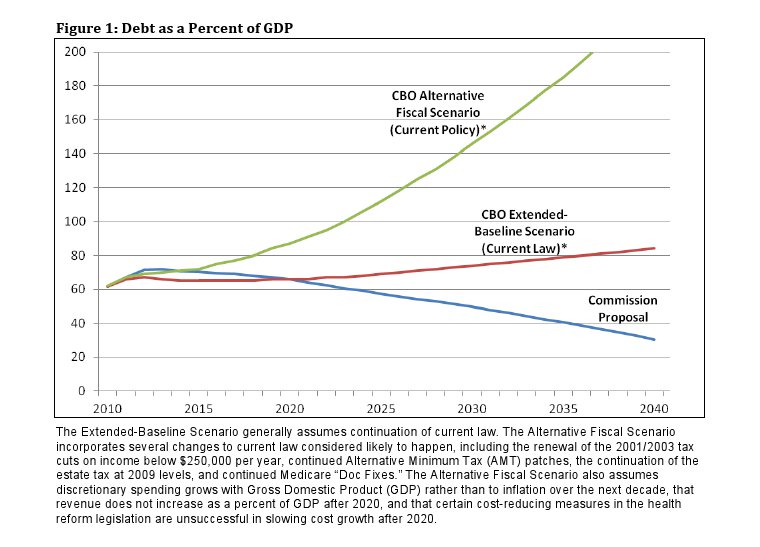
Simpson-Bowles Debt as a Percent of GDP

Click on the chart below to see an enlarged, clearer chart.

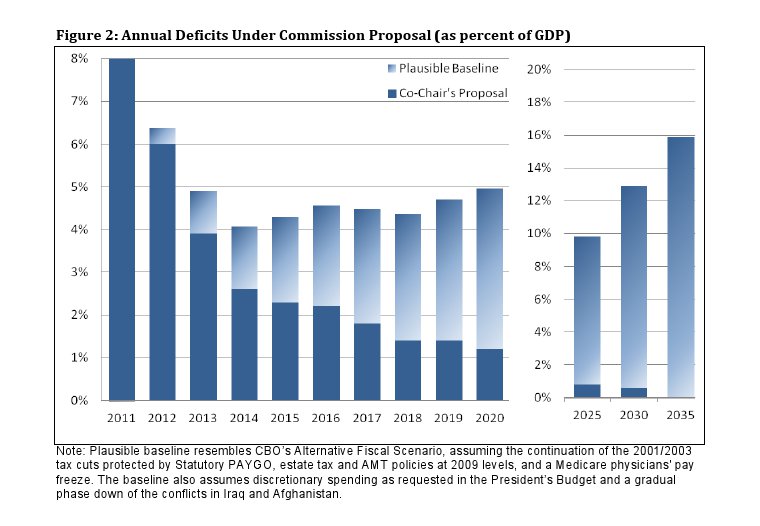
Simpson-Bowles Annual Deficits Under Commission Proposal (as percent of GDP)

Click on the chart below to see an enlarged, clearer chart.

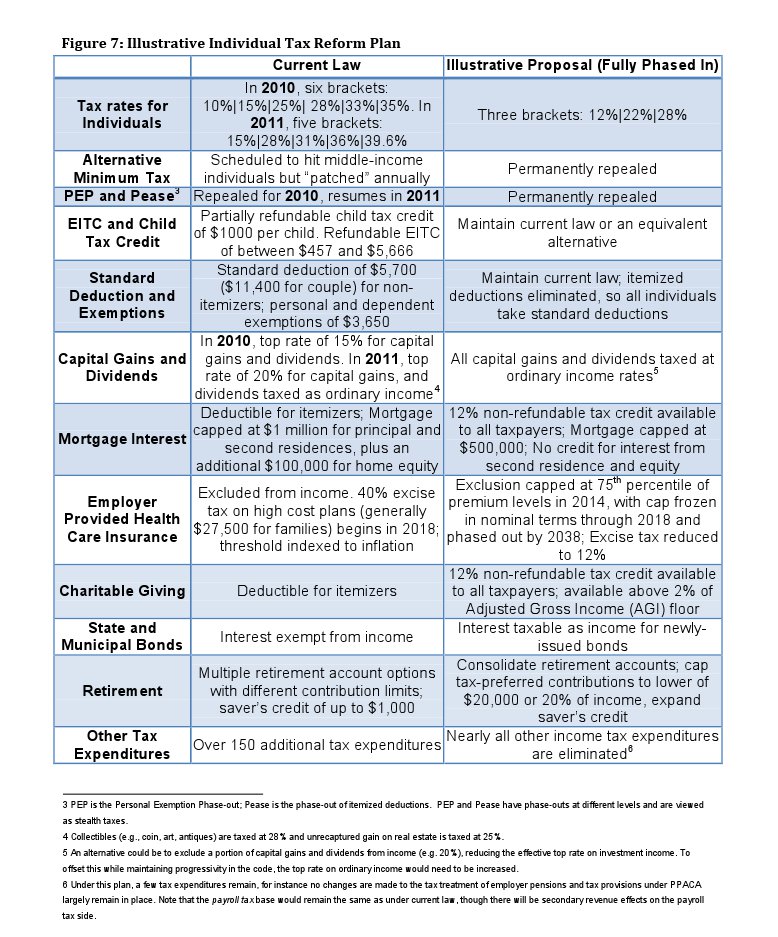
Simpson-Bowles Illustrative Individual Tax Reform Plan

Click on the chart below to see an enlarged, clearer chart.

Simpson-Bowles Illustrative Corporate Tax Reform Plan

Click on the chart below to see an enlarged, clearer chart.

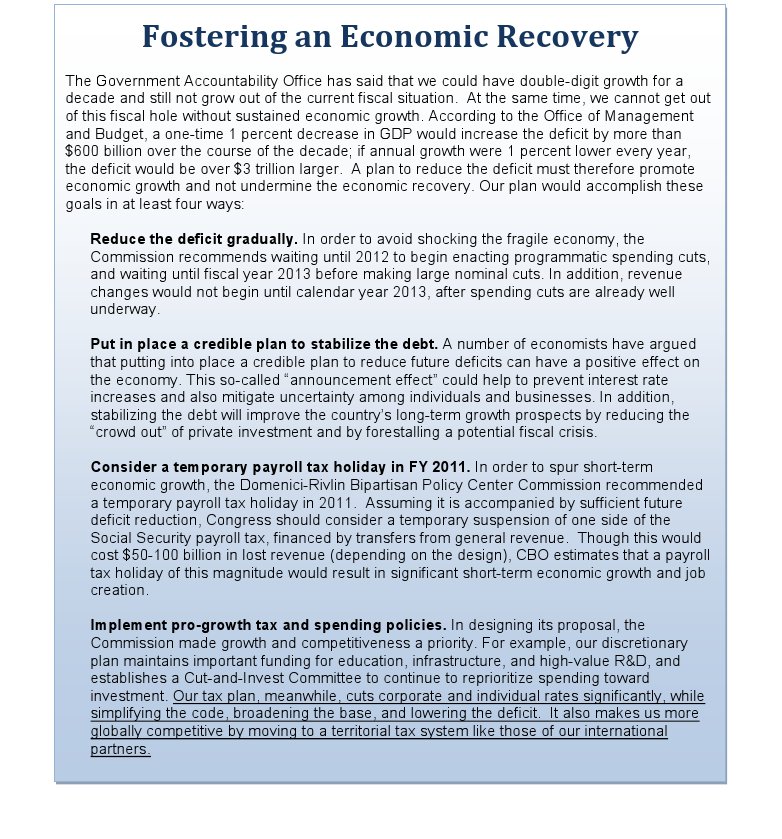
Simpson-Bowles Fostering an Economic Recovery

Click on the chart below to see an enlarged, clearer chart.

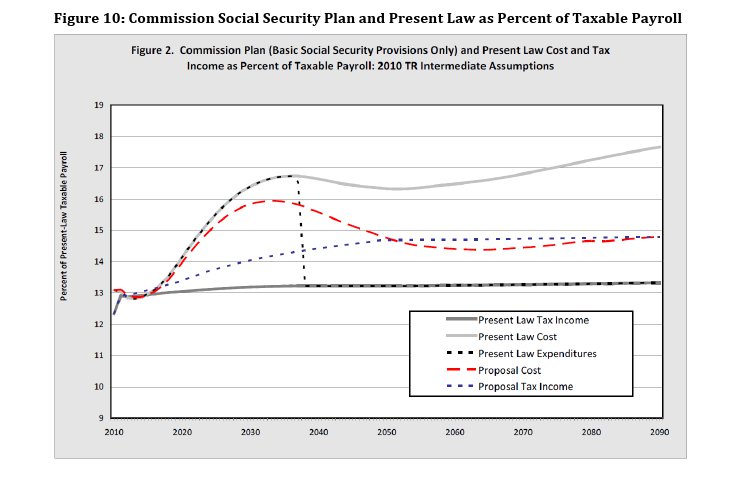
Simpson-Bowles Commission Social Security Plan and Present Law as Percent of Taxable Payroll

To read the entire report, click on The Moment of Truth. To view the Commission website, click on National Commission on Fiscal Responsibility and Reform.


Following are three videos with the co-chairmen of the commission, Erskine Bowles and Alan Simpson.


U.S. Federal Government Revenue (Current & Inflation Adjusted)

 Posted by  Taxes  Comments Off on U.S. Federal Government Revenue (Current & Inflation Adjusted)
Sep 052012
 
Share

truthful politics reviewed historical statistics on U.S. federal government revenue as provided by the Office of Management and Budget. The Office of Management and Budget provides the official numbers for the annual budget for the U.S. This article has several charts on U.S. federal government revenue; click on the chart to expand it; click on the expanded chart to shrink it back to its original size.

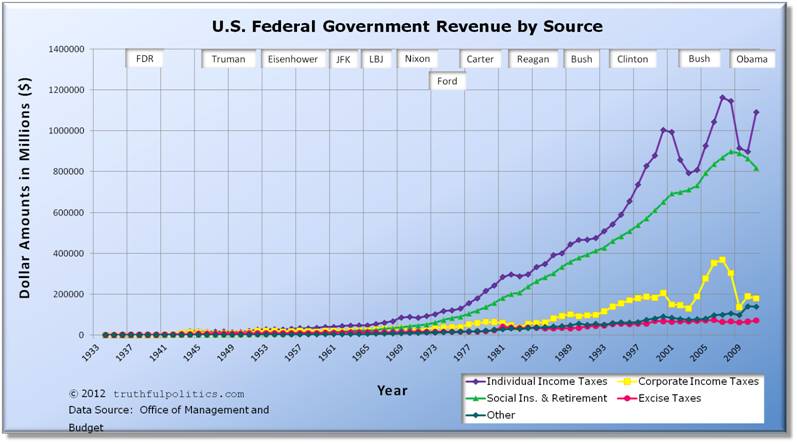
The first chart shows how much tax revenue was received by the federal government annually since 1934. The raw data comes from Table 2.1 of the budget report.

  • The transition quarter, or TQ, in 1976 has been removed.

Click on the chart below to see an enlarged, clearer chart.

U.S. Federal Government Revenue by Source

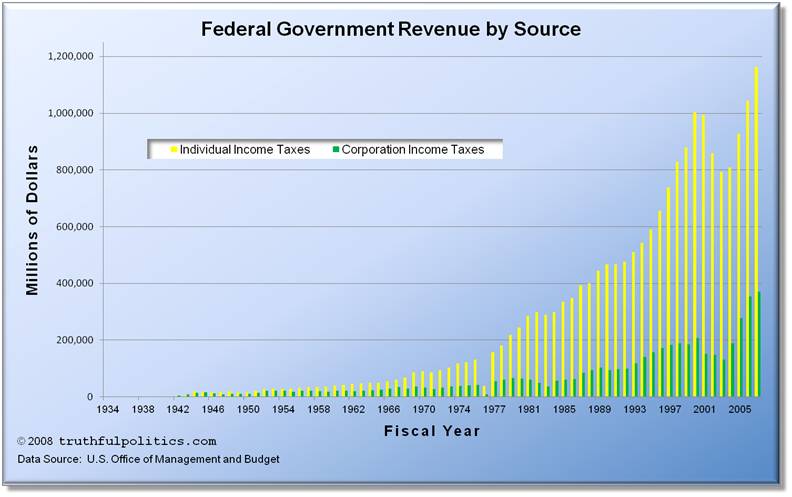
The second chart also shows how much tax revenue was received by the federal government annually since 1934 and its raw data comes from Table 2.1; however, the chart only shows individual and corporate income taxes.

Click on the chart below to see an enlarged, clearer chart.

Federal Government Revenue by Source

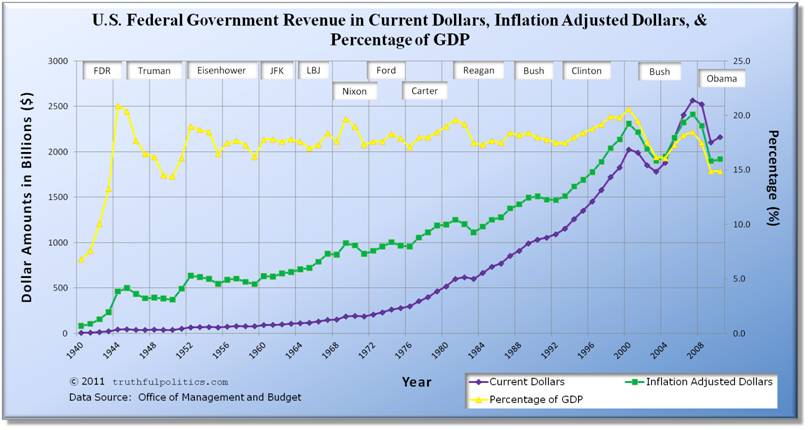
The third chart shows how much tax revenue was received by the federal government annually since 1940. The raw data comes from Table 1.3 of the budget report.

  • Current Dollars displays the amount of revenue received in the value of the currency at the time received.
  • Inflation Adjusted Dollars displays all dollar amounts in constant fiscal year 2005 dollars, as provided by the Office of Management and Budget. Therefore, dollar amounts prior to year 2005 are inflated and dollar amounts after 2005 are deflated. For example, U.S. federal government revenue in 1940 was $6.5 billion dollars; that revenue level is the equivalent of $81.4 billion in 2005 dollars. Likewise, U.S. federal government revenue in 2010 was $2,162.7 billion dollars; that revenue level is the equivalent of $1,919 billion in 2005 dollars.
  • Percentage of GDP is the revenue received divided by the GDP for the year. GDP stands for Gross Domestic Product and is a measure of the economy as it measures the total market value of all final goods and services produced in a country in a given year. Therefore, tax revenue as a percentage of GDP shows U.S. federal government revenue as a percentage of the economy.
  • The transition quarter, or TQ, in 1976 has been removed.

Click on the chart below to see an enlarged, clearer chart.

U.S. Federal Government Revenue in Current Dollars, Inflation Adjusted Dollars, and Percentage of GDP

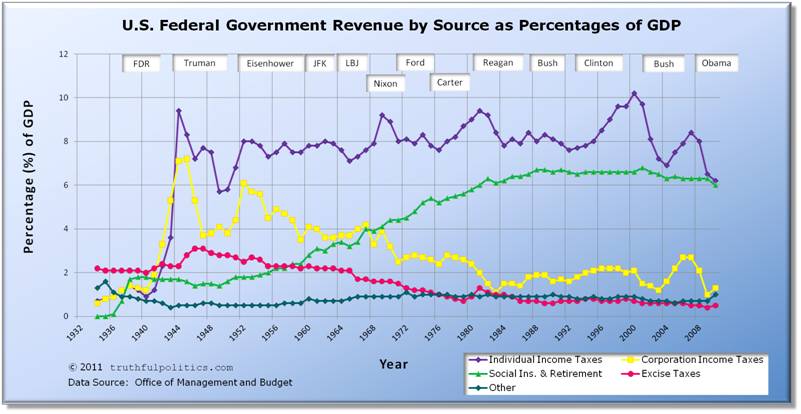
The fourth chart below shows how much tax revenue was received by the federal government annually since 1934 separated by different sources of revenue. The raw data comes from Table 2.3 of the budget report.

  • The transition quarter, or TQ, in 1976 has been removed.
  • Blank years of 1932 and 1933 have been added to make the year markers match presidential terms.

Click on the chart below to see an enlarged, clearer chart.

U.S. Federal Government Revenue by Source as Percentages of GDP

To read additional information, see the raw data, or view additional tables, click on Government Printing Office.

Governor Mitt Romney’s Record in Massachusetts

 Posted by  Miscellaneous Issues  Comments Off on Governor Mitt Romney’s Record in Massachusetts
Aug 152012
 
Share

This article contains statistics on state ranking, economic, education, poverty, debt, and health care areas of Mitt Romney’s record as governor of Massachusetts from 2003 – 2007.

Massachusetts’ ranking in CNBC’s America’s Top States for Business:

Category 2007 2012
Overall 12 28
Cost of Doing Business 40 49
Workforce 26 32
Quality of Life 3 11
Economy 41 21
Infrastructure & Transportation 38 45
Technology & Innovation 4 7
Education 1 3
Business Friendliness 13 29
Access to Capital 2 1
Cost of Living 43 41

To view rankings of all 50 states for both years above, click on America’s Top States for Business 2007 and/or America’s Top States for Business 2012.

Economic statistics:

  • During Romney’s tenure, Massachusetts lost manufacturing jobs faster than the national average
  • Massachusetts rate of losing manufacturing jobs was slower than before and after Mitt Romney took office
  • Massachusetts’ unemployment rate was 5.6% when Romney entered office and 4.7% when he left office
  • Romney vetoed a bill that would ban the state of Massachusetts from “contracting with companies that outsourced labor overseas”
  • In December 2006, Massachusetts’ unemployment rate was 4.7%, while the national average was 4.4%.

To read the entirety of the articles containing the source data, click on Claims and counter-claims on Mitt Romney’s Massachusetts record, Mitt Romney’s Massachusetts record: proof of ‘strong leadership’?, and/or the Bureau of Labor Statistics.

Education statistics:

  • During Romney’s tenure, the number of charter schools increased from 46 to 59
  • Massachusetts placed first on the National Assessment of Educational Progress exams from 2005-2011.
  • 2002-2003 high school (grades 9-12) dropout rate was 3.3%
  • 2006-2007 high school (grades 9-12) dropout rate was 3.8%
  • 2010-2011 high school (grades 9-12) dropout rate was 2.7%

To read the entirety of the articles containing the source data, click on Mitt Romney’s education record was mixed, Romney’s record on education includes successes, failures, and/or Dropout Rates.

Poverty statistics:

The table below shows the percentage of the population below the poverty level.

Year Massachusetts U.S.A.
2000 9.3% 12.4%
2007 9.9% 13.0%
2010 11.4% 15.3%

To view the source data or see data for other years and/or states, click on American FactFinder.

Debt statistics:

  • In 2007, Massachusetts had more debt per person, at $4,153, than any other state
  • Romney slowed the rate of debt growth from 5.8% to 1.9%
  • During Romney’s tenure, state debt averaged 9% of personal income, second worst in the nation.

To read the entirety of the article containing the source data, click on Is Romney’s Massachusetts record really as bad as Obama says?

Health Care statistics:

  • 62% of physicians say the law had no adverse effect on waiting times
  • In 2006, 68.5% of nonelderly adults supported the law, and in 2011, 67% supported it
  • In 2006, Massachusetts’ rate of uninsured was 7.7% (the lowest rate in the country) compared to the national average of 14.8%
  • In 2010, 98.1% of Massachusetts residents had health insurance compared to the national rate of 84.6%
  • The “net added cost to Massachusetts taxpayers was $353 million in 2010, or roughly 1.2 percent of the state budget”
  • About “$487 million of the 2010 Medicaid budget, about 5.2 percent, was for expansions under the health care law. (All those figures are before federal reimbursements.)”

To read the entirety of the article containing the source data, click on ‘RomneyCare’ Facts and Falsehoods.

U.S. Education Spending, Literacy, & Test Scores vs. Other Countries

 Posted by  Education  Comments Off on U.S. Education Spending, Literacy, & Test Scores vs. Other Countries
May 232012
 
Share

This article has several statistics from several sources on the U.S. education system compared to other countries.


The Broad Foundation reported the following:

  • U.S. ranks 21st in high school graduation rate compared to other industrialized nations.
  • U.S. students rank 25th in math compared to other industrialized nations.
  • U.S. students rank 21st in science compared to other industrialized nations.

To read additional information from the Broad Foundation on education, click on Background on the Crisis.


The Master of Arts in Teaching at the University of Southern California in February 2011 created the following chart which has spending, literacy, school life expectancy, and test score statistics:

Click on the chart below to see an enlarged, clearer chart.

U.S. Education Spending, Literacy, & Test Scores vs. Other Countries

To read the entire article, click on U.S. Education Spending and Performance vs. The World [INFOGRAPHIC].


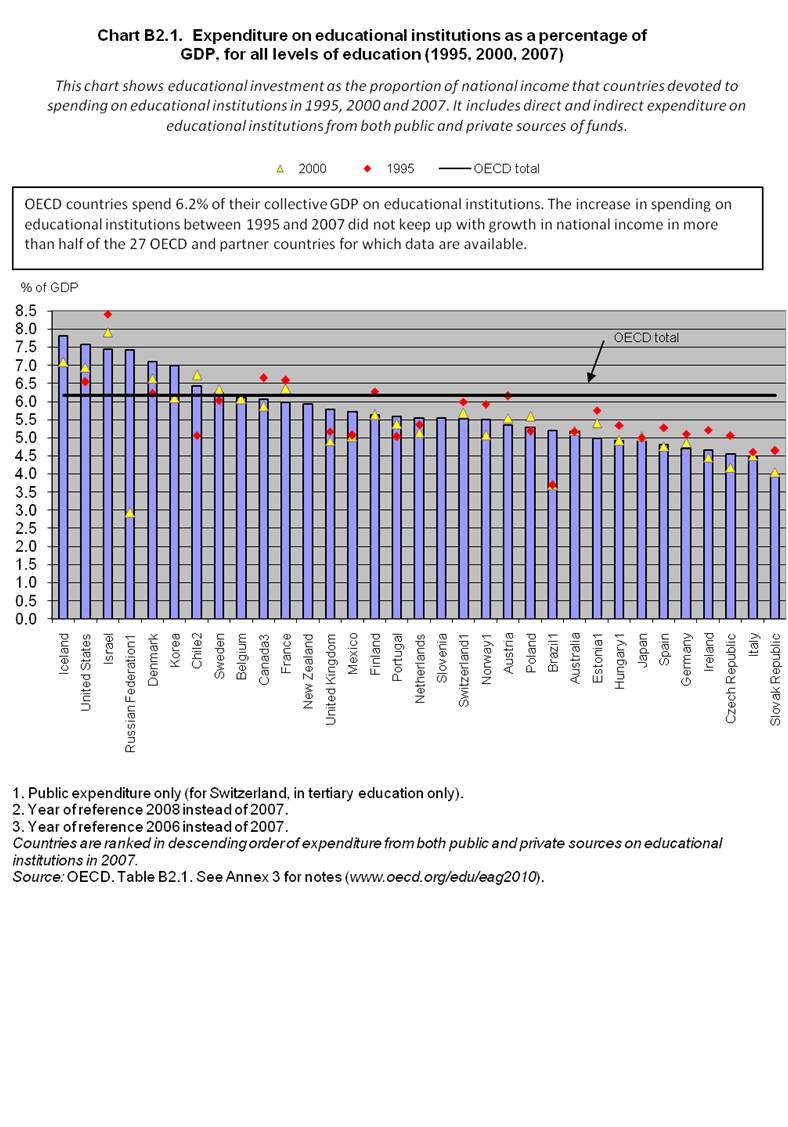
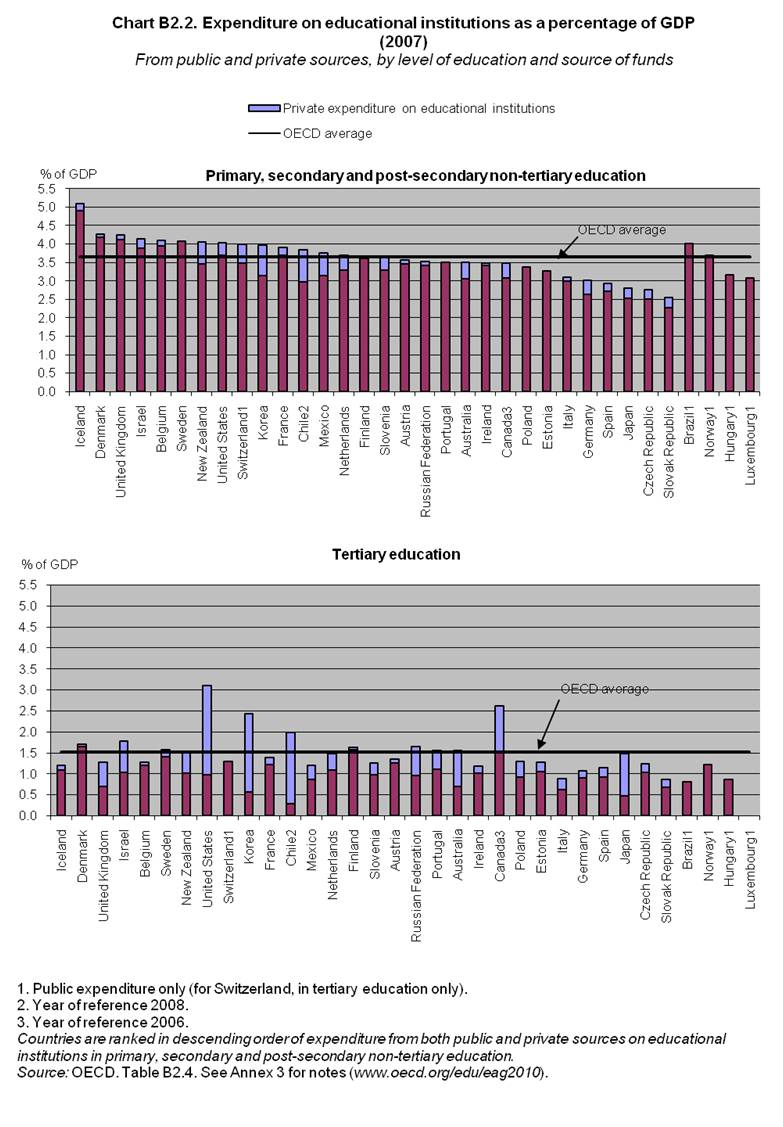
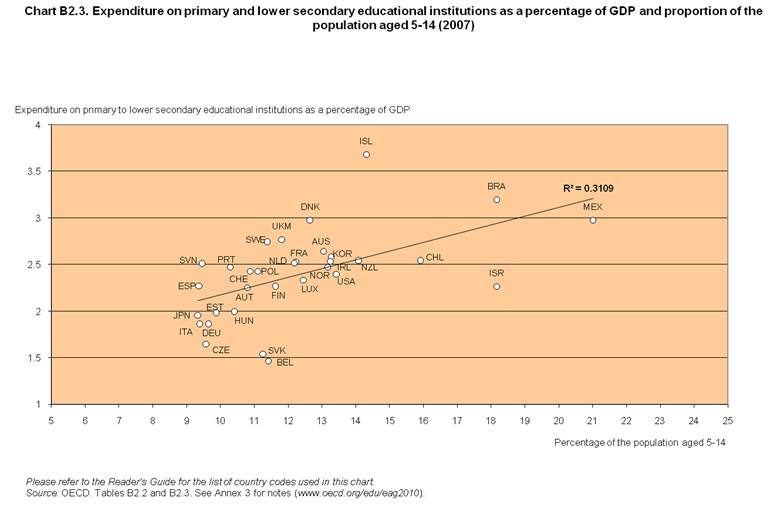
The OECD created the following charts which compare education spending as a percentage of their respective economy (GDP) across several countries:

Click on the chart below to see an enlarged, clearer chart.

Expenditure on educational institutions as a percentage of GDP, for all levels of education

Click on the chart below to see an enlarged, clearer chart.

Expenditure on educational institutions as a percentage of GDP

Click on the chart below to see an enlarged, clearer chart.

Expenditure on primary and lower secondary educational institutions as a percentage of GDP and proportion of the population aged 5-14

To view the source data, click on Key indicators on education and use Indicator B2.  To view other charts and statistics, click on Key indicators on education.

Supreme Court Information

 Posted by  Miscellaneous Issues  Comments Off on Supreme Court Information
Apr 252012
 
Share

The Supreme Court of the United States was created in 1789. It’s Constitutional origin is in Article III. The court consists of a Chief Justice and eight Associate Justices. According to the Supreme Court official website, “The Supreme Court is the highest tribunal in the nation for all cases and controversies arising under the Constitution or the laws of the United States. The Court stands as the final arbiter of the law and guardian of constitutional liberties.”

To read more information about the Supreme Court, click on Supreme Court of the United States. To see a list of all Supreme Court Justice nominations, whether they were confirmed or not, the president who nominated them, etc., click on Supreme Court Nominations, Present-1789. To see Supreme Court statistics, click on SCOTUSblog Statistics.

Adam Liptak in The New York Times in November 2010 reported the following:

  • The Brown v. Board of Education decision in 1954 that said segregated public schools are unconstitutional was fewer than 4,000 words.
  • The Parents Involved v. Seattle in 2007 was 47,000 words.
  • Some decisions have been vague or ambiguous.
  • “In the 1950s, the median length of decisions was around 2,000 words.”
  • The Citizens United v. Federal Election commission decision in 2010 was more than 48,000 words.

To read the entire article, click on Justices Are Long on Words but Short on Guidance.

Carol J. Williams in the Los Angeles Times in April 2011 reported the following:

  • Korematsu v. United states in 1944 allowed the “internment of 110,000 Japanese Americans without individual cause or suspicion.”
  • Dredd Scott v. Sandford in 1857 decided that descendants of slaves were not entitled to Constitution liberties, including freedom and U.S. citizenship.
  • Buck v. Bell in 1927 said that institutionalized individuals may be sexually sterilized.

To read the entire article, click on Legal scholars examine the U.S. high court’s ‘Supreme Mistakes’.

The following video is from 60 Minutes in 2010:

To view the 60 Minutes website, click on 60 Minutes.

Jul 142011
 
Share

truthful politics has 3 different charts showing the number of jobs created in the U.S. organized by presidential terms and/or political party.

Apr 302011
 
Share

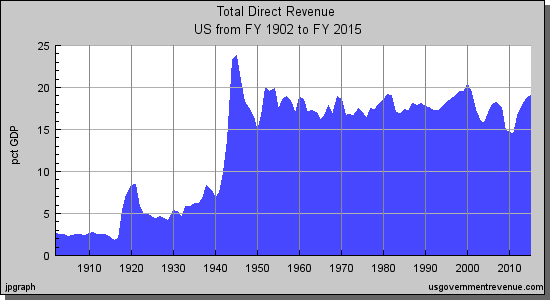
Below are statistics from several sources on if cutting taxes increase or decrease government revenue, or tax receipts. The first chart shows government revenue as a percentage of the economy, or Gross Domestic Product (GDP). The major tax cuts occurred in 1918 – 1925, 1964, 1981, 2001, and 2003.

Click on the chart below to see an enlarged, clearer chart.

U.S. Federal Government Revenue as a Percent of GDP from 1902 to 2015

For additional data, click on usgovernmentrevenue.com.


In the Bonddad Blog, information is available about cutting taxes for either the wealthy or the lower income classes.

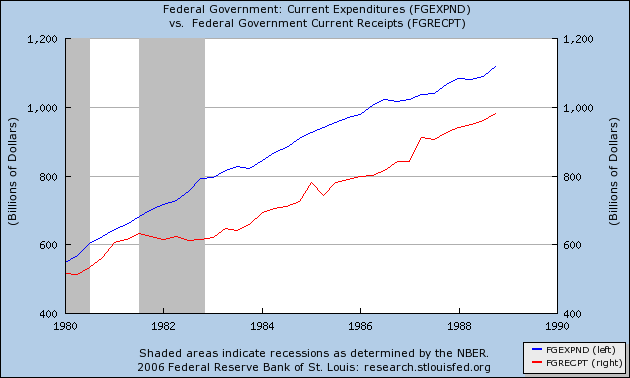
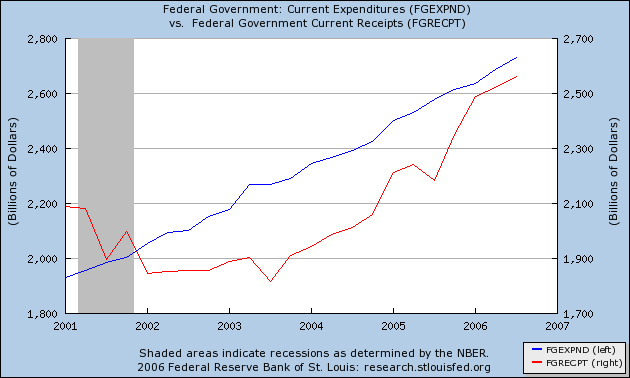
  • The following charts show government expenditures and government revenue during the 1980’s and the 2000’s.
  • Tax cuts were enacted in the early 1980’s and early 2000’s.
  • The blog concludes saying “the growth achieved is insufficient to stimulate the economy to high enough levels to make-up for the loss in revenue.”

Click on the chart below to see an enlarged, clearer chart.

1980 to 1988 federal government expenses and revenue

Click on the chart below to see an enlarged, clearer chart.

2001 to 2007 federal government expenses and revenue

To read the entire article, click on The Complete Failure of Supply-Side Economics.


Factcheck.org in June 2007 reported the following about tax cuts in 2001 and 2003 and the correlation with increased tax revenues:

  • “Federal revenue normally increases every year. In fact, revenues have declined in only five years since 1962.”
  • Tax revenues from 2000 to 2003 actually declined every year.
  • Tax revenues started to increase in 2004. The Office of Management and Budget described the increase in tax revenue in the years 2004-2006 as a return to the historical average. “As a percentage of GDP, federal receipts are now 18.4 percent of GDP (in line with the 40-year historical average of 18.3 percent).”
  • “The bulk of the growth in federal receipts has been in corporate tax revenue.”

To read the entire article, click on Supply-side Spin.


Daniel Mitchell in The New York Times in February 2002 said the following:

  • “In the 1960’s, President John F. Kennedy cut the top rate to 70 percent from 91 percent. Between 1961 and 1968, as the economy expanded by more than 42 percent and tax revenues rose by one-third, the rich saw their share of the tax burden climb to 15.1 percent from 11.6 percent.”
  • “In the 1980’s, the top marginal rate was cut to 28 percent from 70 percent. Critics charge that this caused higher federal budget deficits, but they misread the evidence. Although the Reagan tax cut was approved in 1981, it was phased in slowly (much as the Bush tax cut is scheduled to be). Once the cuts were in place, the economy grew and tax revenues soared. Revenues from personal income taxes increased 28 percent (adjusted for inflation) by 1989. And yes, the rich wound up paying more. The share paid by the top 10 percent jumped to 57.2 percent from 48 percent of total income tax revenues. The share for the top 1 percent rose to 27.5 percent in 1988 from 17.6 percent in 1981.”

The entire article may be read by clicking on Cutting Taxes Faster Would Help Everyone.


Stephen Moore in The Wall Street Journal in June 2005 said the following:

“Earlier this month the Congressional Budget Office released its latest report on tax revenue collections. The numbers are an eye-popping vindication of the Laffer Curve and the Bush tax cut’s real economic value. Federal tax revenues surged in the first eight months of this fiscal year by $187 billion. This represents a 15.4% rise in federal tax receipts over 2004. Individual and corporate income tax receipts have exploded like a cap let off a geyser, up 30% in the two years since the tax cut. Once again, tax rate cuts have created a virtuous chain reaction of higher economic growth, more jobs, higher corporate profits, and finally more tax receipts.”

The entire article can be read by clicking Real Tax Cuts Have Curves.


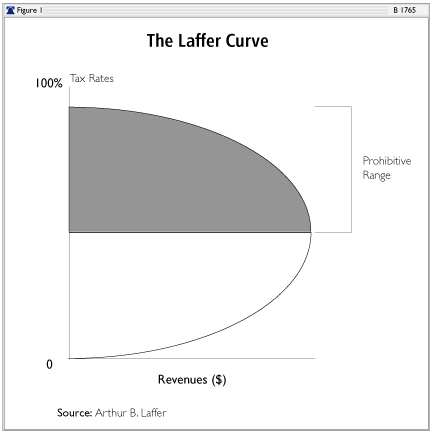
The Heritage Foundation has an article describing the Laffer Curve.

The following graph describes the Laffer Curve:

the Laffer Curve

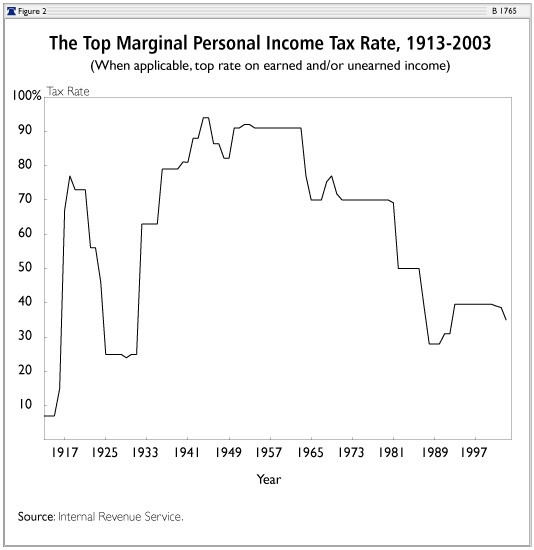
The following graph illustrates the top income tax rate over time:

Click on the chart below to see an enlarged, clearer chart.

Top Marginal Personal Income Tax Rate from 1913 to 2003

The Harding-Coolidge tax cuts decreased the top marginal tax rate from 77% in 1918 to 25% by 1925. The Heritage Foundation says that “over the four years following the tax-rate cuts, revenues remained volatile but averaged an inflation-adjusted gain of 0.1 percent per year. The economy responded strongly to the tax cuts, with output nearly doubling and unemployment falling sharply.”

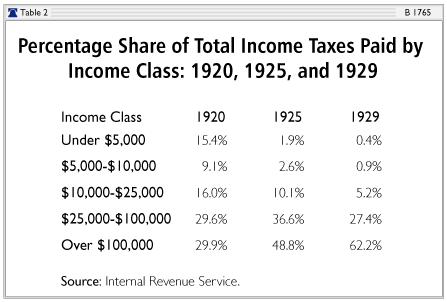
The following graph illustrates the percentage of total income taxes paid by different income brackets:

Percentage Share of Total Income Taxes Paid by Income Class from 1920 to 1929

The Kennedy tax cut in 1964 decreased the top marginal personal income tax rate from 91 percent to 70 percent. The Heritage Foundation says that “in the four years following the tax cut, federal government income tax revenue increased by 8.6 percent annually and total government income tax revenue increased by 9.0 percent annually. Government income tax revenue not only increased in the years following the tax cut, it increased at a much faster rate.”

The Economic Recovery Tax Act of 1981, signed into law under President Reagan reduced several different tax rates. The Heritage Foundation says that “between 1978 and 1982, the economy grew at a 0.9 percent annual rate in real terms, but from 1983 to 1986 this annual growth rate increased to 4.8 percent.” The Foundation continued, “the unemployment rate, which peaked at 9.7 percent in 1982, began a steady decline, reaching 7.0 percent by 1986 and 5.3 percent when Reagan left office in January 1989” and “between 1983 and 1986, federal income tax revenue increased by 2.7 percent annually, and total government income tax revenue increased by 3.5 percent annually.”

To read the entire article, click on The Laffer Curve: Past, Present, and Future.